Fig 1.
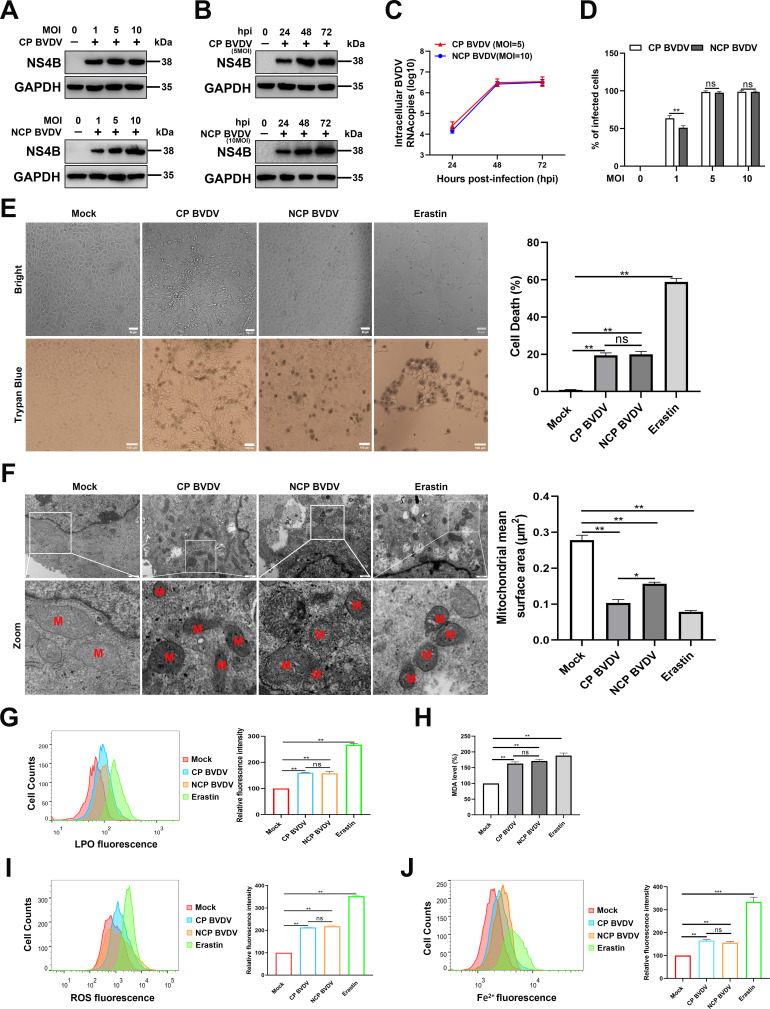
Both biotypes of BVDV induce ferroptosis in MDBK cells. (A) Western blot analysis of NS4B protein in mock-infected, BVDV-infected (MOI = 1, 5, 10), and mock-infected MDBK cells. Equal amounts of protein from BVDV- and mock-infected cells were separated using SDS-PAGE and transferred to PVDF membranes. The membranes were probed with NS4B antibody. (B) Western blot analysis of NS4B protein in mock-infected, CP BVDV-infected (MOI = 5), and NCP BVDV-infected (MOI = 10) MDBK cells from 24 to 72 hpi. (C) qRT-PCR analysis of BVDV Npro gene in CP BVDV (MOI = 5)- and NCP BVDV (MOI = 10)-infected cells from 24 to 72 hpi. (D) Both biotypes of BVDV-infected cells (MOI = 1, 5, 10) were bound with BVDV NS4B antibody and then labeled with fluorophore-conjugated antibody or matched isotype controls and analyzed by flow cytometry at 48 hpi. (E) The percentage analysis of dead cells in mock-infected, CP BVDV (MOI = 5)-infected, and NCP BVDV (MOI = 10)-infected cells stained with trypan blue solution. Erastin (10 µM) as a positive control. Scale bar = 100 µm. (F) Transmission electron microscopy analysis of mitochondrial morphology in mock-infected, CP BVDV (MOI = 5)-infected, and NCP BVDV (MOI = 10)-infected cells at 48 hpi. Erastin (10 µM) as a positive control. Representative images of normal mitochondria or dysfunctional mitochondria are shown. Scale bar = 0.5 µm. (G) Flow cytometry analysis of intracellular lipid peroxidation levels in mock-infected, CP BVDV (MOI = 5)-infected, and NCP BVDV (MOI = 10)-infected cells stained with Lipofluo (5 µM) at 48 hpi. Then the mean fluorescence intensity of each cell was quantified. Erastin was used as the positive control. (H) Detection of malondialdehyde concentrations in mock-infected, CP BVDV (MOI = 5)-infected, and NCP BVDV (MOI = 10)-infected cells at 48 hpi. (I) Flow cytometry analysis of intracellular ROS levels in mock-infected, CP BVDV (MOI = 5)-, and NCP BVDV (MOI = 10)-infected cells stained with dichloro-fluorescein diacetate (1 µM) at 48 hpi. Then the mean ROS fluorescence intensity of each cell was quantified. Erastin was used as the positive control. (J) Flow cytometry analysis of cellular ferrous iron in mock-infected, CP BVDV (MOI = 5)-, and NCP BVDV (MOI = 10)-infected cells stained with FerroOrange (1 µM) at 48 hpi. Then the mean FerroOrange fluorescence intensity of each cell was quantified. Erastin as a positive control. Data are given as means ± standard deviation from three independent experiments. P values were calculated using Student’s t test. An asterisk indicates a comparison with the indicated control. *, P < 0.05; **, P < 0.01; ns, not significant.

