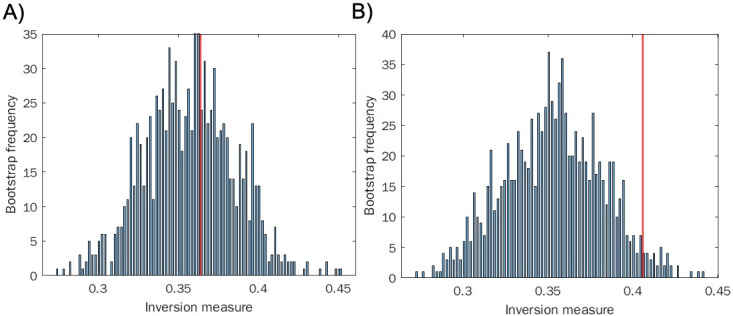
Fig 2.

Inversion method of bootstrap for locally linear approximation of the distributions (histograms). (A) Sampling from a geometric distribution. (B) Sampling from the chaotic quadratic map. Red line indicates the actual inversion measure of the distribution. Cautionary note: the results derived by the inversion method presented in panel A, though in agreement with our hypothesis, are sensitive to parameter choice and can vary from run to run, even with a large sample size. In the text, please see a discussion of the false-positive levels as a function of the histogram’s number of bins, for data coming from the Weibull, a generalized exponential distribution.
