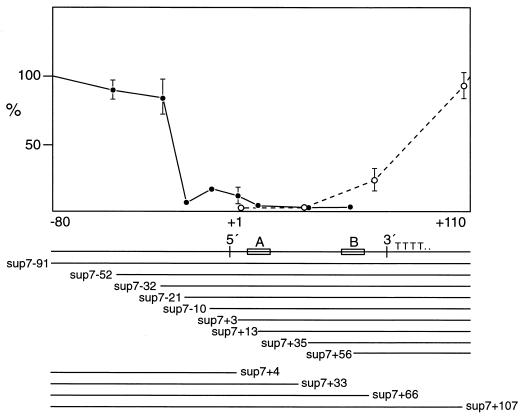
FIG. 3.
Graphical representation of transcription of sup-7 deletion clones in vitro. Transcript labelling was quantitated as for Fig. 2. The line below the graph shows the tRNA, with 5′ and 3′ boundaries, A and B box internal promoters, and the TTTT termination sequence. The extent of DNA remaining after deletions is shown under the tRNA map.

