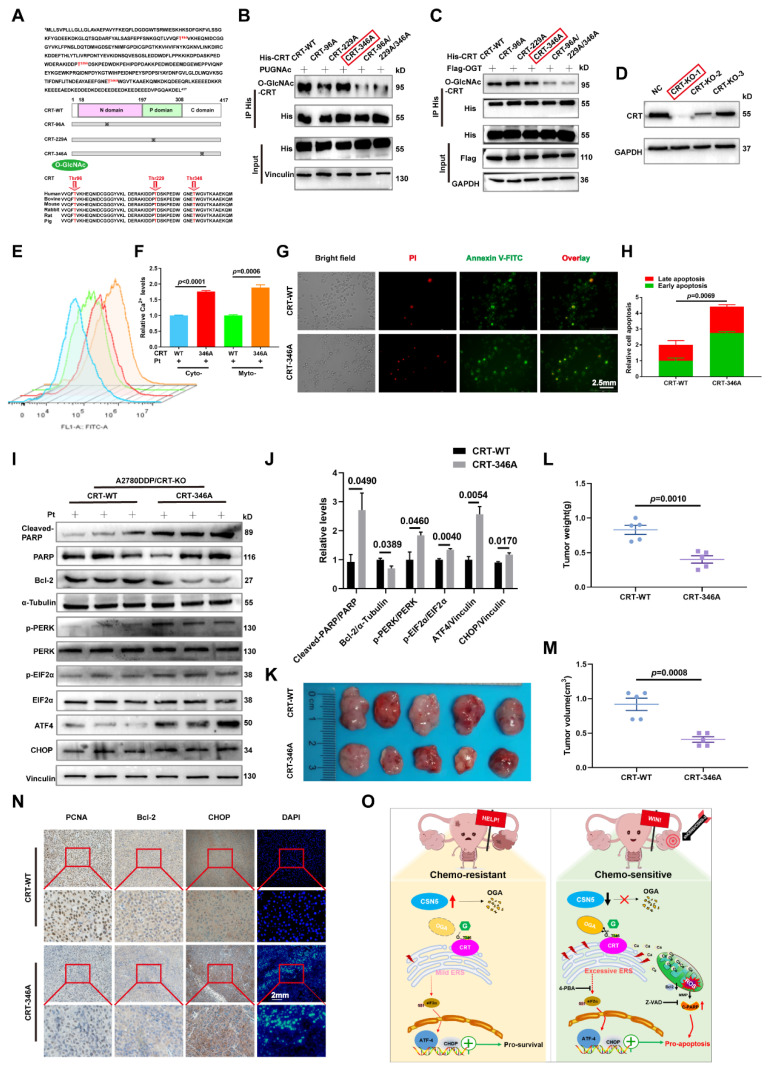
Figure 7.
O-GlcNAcylation of CRT at T346 confers EOC cells with tolerance to platinum-induced cell death. (A) Potential O-GlcNAc modified sites of CRT were identified by IP-MS, and conservation analysis was performed. (B) Flag-tagged point mutation plasmids were constructed for all potential O-GlcNAcylated sites of CRT, and HEK293T cells were transfected with indicated point mutants of CRT for 24 h. Then, HEK293T-CRT-WT and alanine-substituted CRT cells were treated with PUGNAc (an inhibitor of OGA, 25 μM) for another 24 h followed by IP-IB analysis. (C) HEK293T cells were transfected with indicated point mutants of CRT accompanied by Flag-OGT for 24 h. Then, the protein expression levels and the O-GlcNAcylation status were analyzed by IP-IB. (D) Validation of the CRT knock out efficiency in HEK293T cells by IB. (E) CRT-KO A2780/DDP cells stably expressing His-CRT (WT or T346A) were treated with cisplatin (20 μM) for 24 h, and then subjected to FCM analysis of Ca2+. (F) The levels of Ca2+ were statistically analyzed and shown as mean ± SEM. (G) Cellular apoptosis was examined by immunofluorescent staining in CRT-KO A2780/DDP cells stably expressing His-CRT (WT or T346A) after the treatment with cisplatin (20 μM) for 24 h (Scale bar = 2.5 mm), and the ratio of apoptotic cells was quantified and statistically analyzed (H). (I) The apoptotisis and ER stress markers were detected by IB, and the relative protein quantification was performed and statistically analyzed (J). (K) In vivo xenograft model showed the tumor suppressive effects of CRT T346A mutant. (L, M) Tumor volume and weight were analyzed. (N) IHC results exhibited the expression of the proliferative marker PCNA, the anti-apoptotic marker Bcl-2, and ER stress marker CHOP. Apoptotic cells were displayed via DAPI staining (Scale bar = 2 mm). (O) Schematic illustration depicting the significance of the CSN5/CRT O-GlcNAc/ER stress axis in platinum-resistant ovarian carcinoma.

