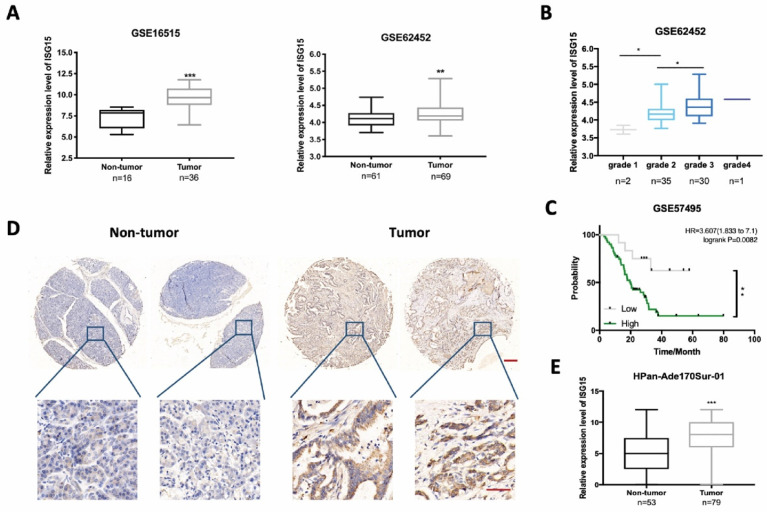
Figure 1.
ISG15 is highly expressed in pancreatic cancer (PC) tissues. A, Bioinformatics analysis of ISG15 in PC tumor and non-tumor tissues using data from GSE16515 and GSE62452 with numbers enrolled (n) indicated on the bottom. B, Box-plot of the expression of ISG15 in PC tissues of different differentiation grades. C, Log-rank analysis of the correlation between ISG15 expression and survival of 63 PC patients using data from GSE57495. D, Representative images of ISG15 IHC staining in tumor and non-tumor tissues from PC microarray HPan-Ade170Sur-01 (scale bar; 50 μm) with zoomed-in pictures shown on the bottom (scale bar; 200 μm). E, Box-plot of the expression of ISG15 in tumor and adjacent non-tumor tissue sections from PC microarray. Method of H-score evaluation was described in Methods and Materials. (* p<0.05; ** p<0.01; *** p<0.001).

