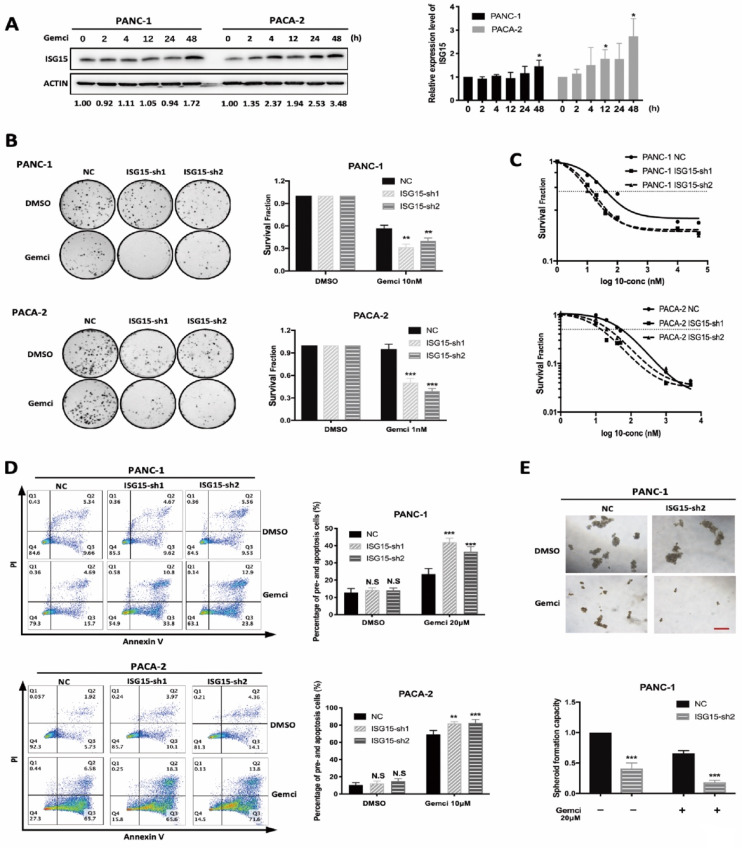
Figure 3.
ISG15 expression correlates with resistance to Gemcitabine. A, ISG15 expression was elevated after Gemcitabine (Gemci) treatment. PC cells were treated with DMSO and Gemcitabine. After different times of treatment, cells were collected and lysed for Western blotting analysis. Grey value of ISG15 was detected and normalized by ACTIN. Relative expression level of ISG15 was calculated as normalized grey value of certain time point / normalized grey value of ISG15 at time 0. Representative results of Western blotting are shown on the left, and quantitative results of at least three independent results are on the right. B-C, Down-regulation of ISG15 increased PC cell sensitivity to Gemcitabine. B, In colony formation assays, 24h after cells were plated, Gemcitabine was added for additional 24-hour incubation and then removed for colony formation. Representative results of colony formation assays are shown on the left with quantitative results of at least three independent results shown on the right. For the concentration of Gemcitabine used in the assay of colony formation, we conducted preliminary experiments using PANC-1 and PACA-2 cells (data not shown), and chose 10nM Gemcitabine to treat PANC-1 cells, and 1nM Gemcitabine to treat PACA-2 cells. C, Survival fraction in different concentration of Gemcitabine was calculated using CCK-8 assay. 24h after cells were plated, different concentrations of Gemcitabine was added. 48h later, CCK-8 detection was performed. Survival fraction (SF) is calculated following the formula: SF= (absorbance at certain concentration) / (absorbance at control) while DMSO was used as control. Representative results of at least three independent experiments are shown. D, Knock-down of ISG15 increased PC cell apoptosis after Gemcitabine treatment. Representative results of flow cytometry analysis are shown on the left with quantitative results shown on the right. E, ISG15 down-regulation enhanced the inhibition of spheroid formation by Gemcitabine. Representative results of spheroid formation are shown on the top panel with quantitative result shown on the bottom (scale bar; 50 μm). (* p<0.05; ** p<0.01; *** p<0.001).

