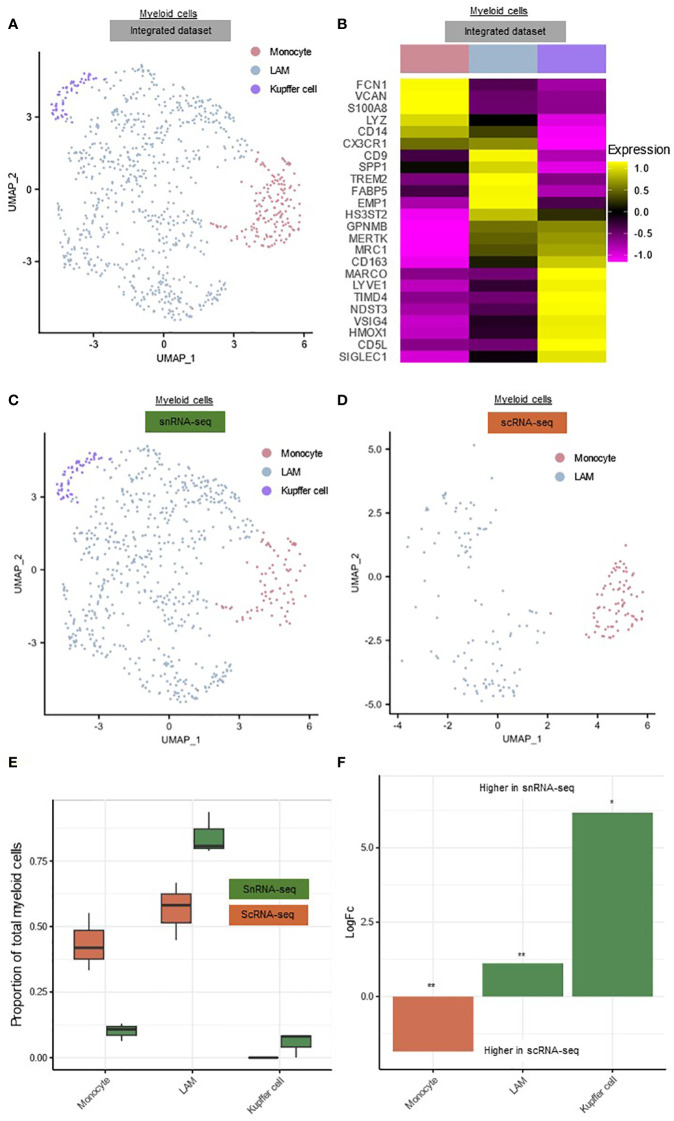
Figure 2.
Comparison of the hepatic myeloid landscape detected by snRNA-seq or scRNA-seq. (A) Annotated UMAP plot of 689 single nuclei and 187 single cells of the myeloid cells, showing the different subpopulations. (B) Heatmap showing marker gene expression for the subclusters of the myeloid cells. (C) Annotated UMAP plot of 689 single nuclei of the myeloid cells, showing the different subpopulations (D) Annotated UMAP plot of 187 single cells of the myeloid cells, showing the different subpopulations (E) Boxplot showing the percentage of every myeloid subpopulation in each sample. (F) Barplot showing mean LogFC per subpopulation of the myeloid cells, as calculated using MiloR. P-value adjusted for multiple testing being the minimum SpatialFDR. * padj<0.05, ** padj<0.01, scRNA-seq, single-cell RNA-sequencing; snRNA-seq, single-nucleus RNA-sequencing; UMAP, uniform manifold approximation and projection.

