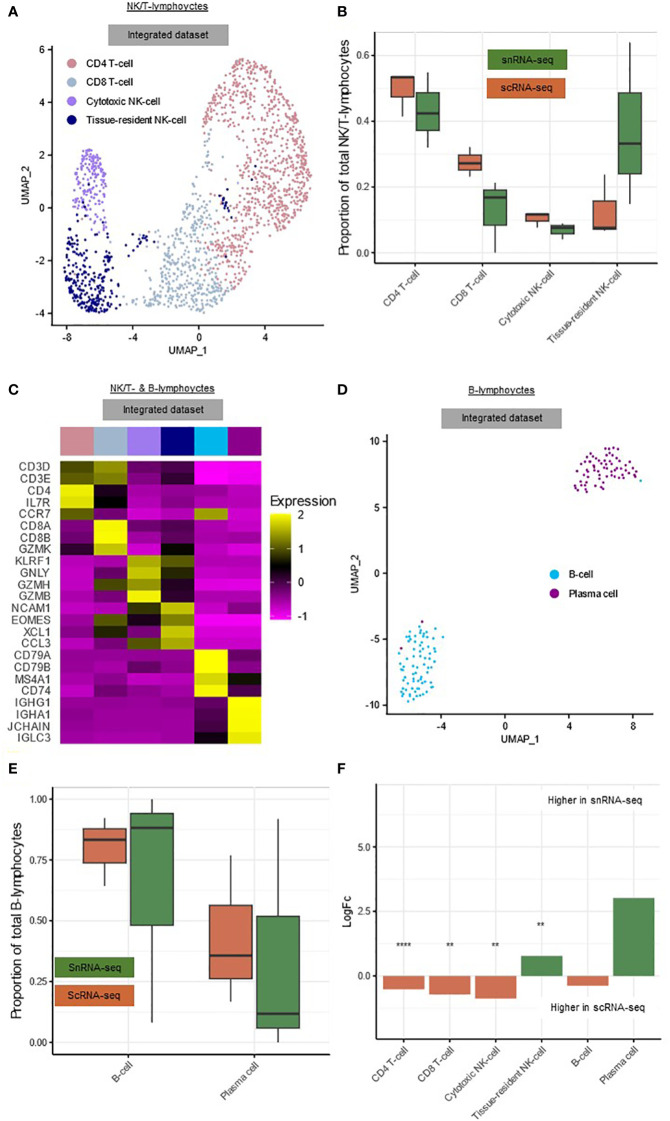
Figure 3.
snRNA-seq and scRNA-seq differentially detect subclusters of hepatic lymphocytes. (A) Annotated UMAP plot of 573 single nuclei and 1,143 single cells of the NK/T-lymphocytes, showing the different subclusters. (B) Boxplot showing the percentage of every NK/T-lymphocyte subpopulation in each sample. (C) Heatmap showing marker gene expression for the subclusters of the NK/T- and B-lymphocytes. (D) Annotated UMAP plot of 99 single nuclei and 46 single cells of the B-lymphocytes, showing the different subclusters and techniques. (E) Boxplot showing the percentage of every B-lymphocyte subpopulation in each sample. (F) Barplot showing mean LogFC per subcluster of the immune cells, as calculated using MiloR. P-value adjusted for multiple testing being the minimum SpatialFDR. ** padj<0.01, **** padj<0.0001. scRNA-seq, single-cell RNA-sequencing; snRNA-seq, single-nucleus RNA-sequencing; UMAP, uniform manifold approximation and projection.

