Figure 3.

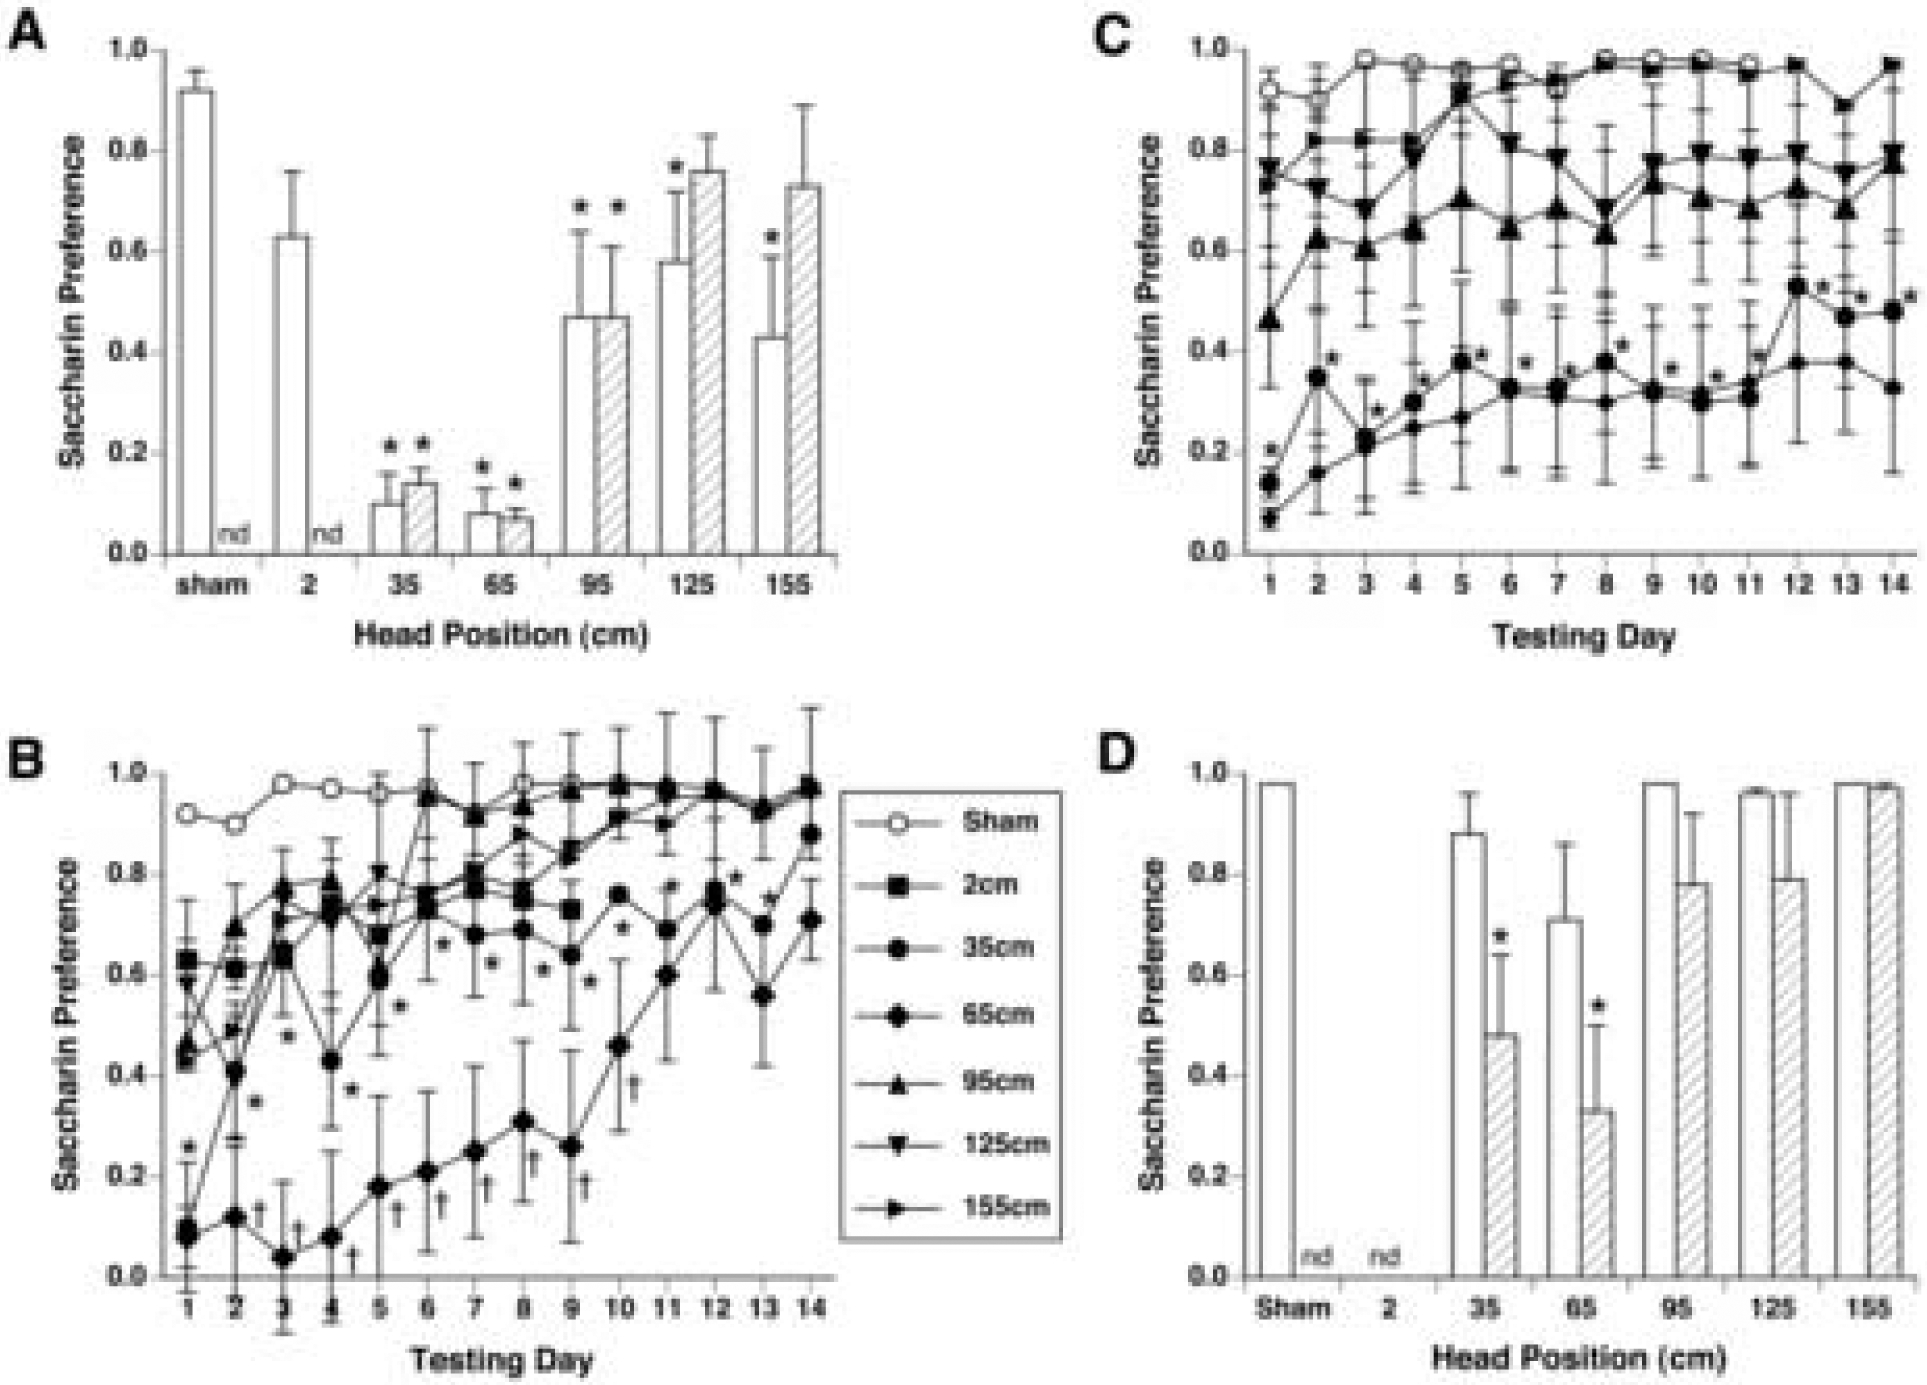
A. Initial magnitude of conditioned taste aversion (CTA) measured by saccharin preference (mean ± s.e.m.) on the first day of 2-bottle preference testing in male (white bars) and female rats (hatched bars.) B. Time course of CTA extinction across 14 days of 2-bottle preference tests in male rats. * p <0.05 35-cm group vs. sham-exposed rats; † p < 0.05 65-cm group vs. 35-cm group. C. Time course of CTA extinction in female rats. Saccharin preference in female rats exposed at 35 and 65 cm was significantly lower than sham-exposed rats on all 14 days. * p < 0.05 35-cm and 65-cm groups vs. sham-exposed rats. Other groups were not different from sham-exposed rats. nd, not determined for female rats. D. Saccharin preference on the last day of 2-bottle preference testing (day 14). The CTA of male rats (white bars) extinguished by day 14, while the saccharin preference of female rats (hatched bars) exposed at 35 cm and 65 cm were still significantly lower than sham-exposed rats. * p < 0.05 vs sham-exposed rats.
