
Figure 6.
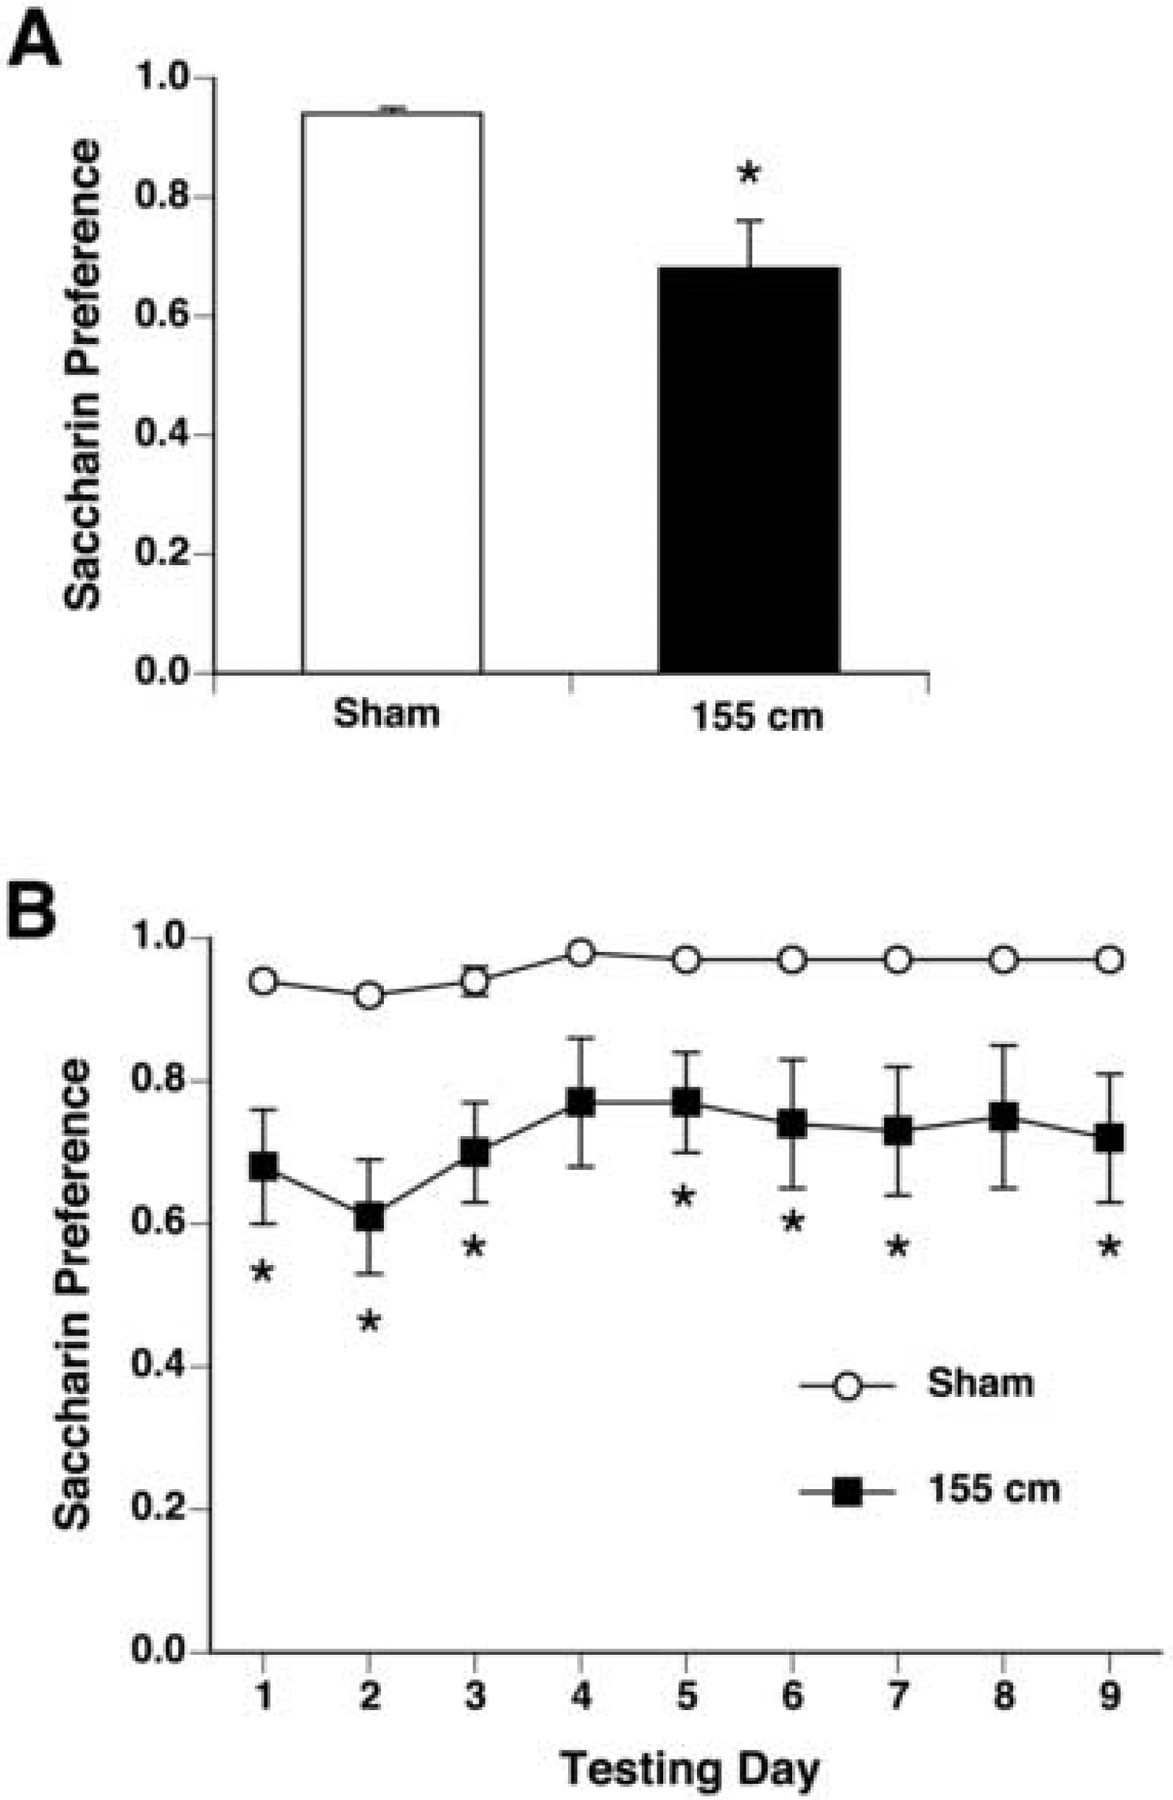
Initial magnitude (A) and extinction (B) of CTA measured by saccharin preference (mean ± s.e.m.) in males exposed at 155 cm (black bar and squares; n = 16) or in sham-exposed males (white bar and circles; n = 8). At this point the magnetic field was 0.05 T at the rats’ head, and a small but significant CTA was acquired. * p < 0.05 vs sham-exposed group.