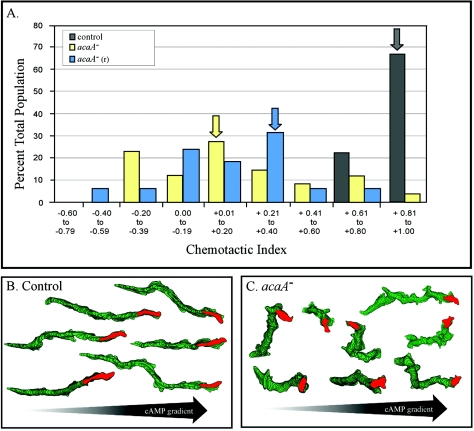
FIG. 2.
acaA− and acaA−(r) cells are chemotactically responsive to a spatial gradient of cAMP but exhibit a decrease in efficiency. (A) Histograms of the chemotactic indices of individual control (JH10) and mutant [acaA− and acaA−(r)] cells reveal a decrease in the efficiency of mutant cell chemotaxis. Arrows indicate the mean chemotactic index for each cell line. Over 20 individual cells were analyzed for each cell line. Note that the majority of chemotactic indices of the two mutant lines were in the positive range, but the distributions were at far lower chemotactic values than JH10 cells. (B and C) Perimeter tracks reveal that although net progress is on average in the direction of the increasing spatial gradient of cAMP, mutant cells turn more often, taking cells off track. The red reconstruction represents the last in each track. Cells were reconstructed at 8-sec intervals.

