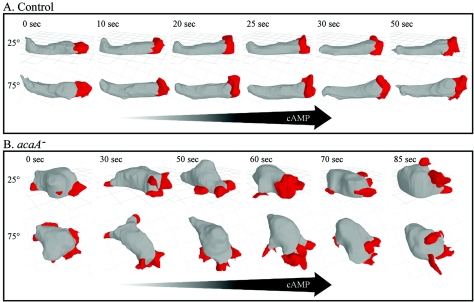
FIG. 3.
3D-DIAS reconstructions of a representative control (JH10) cell (A) and a representative acaA− cell (B) translocating up a spatial gradient of cAMP reveal abnormalities both in pseudopod formation and cell shape. Cell bodies are colored gray and pseudopodia are red. Each cell was viewed at 25 and 75° angles. The arrows indicate the direction of the increasing spatial gradient of cAMP. Note the elongate shape and single dominant anterior pseudopod of the control cell, distinct from the round, more hemispheric shape and complex multipseudopodial extensions of the mutant cell.

