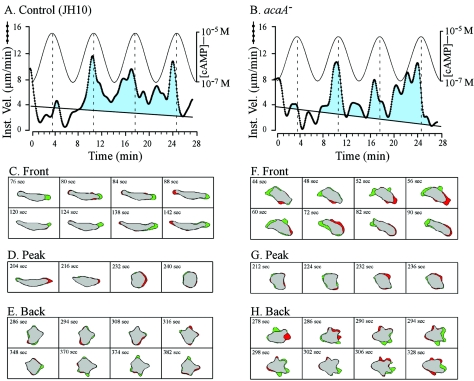
FIG. 4.
The velocity of a representative control (JH10) cell (A) and a representative acaA− cell (B) in a series of four simulated temporal waves of cAMP generated in a perfusion chamber reveals no difference in the surging responses to the front of the three last in a series of four simulated temporal waves of cAMP. Difference pictures of a representative control (JH10) cell (C, D, and E) and a representative acaA− cell (F, G, and H) reveal normal behavioral responses to the peak and back of the third in a series of four temporal waves of cAMP. In this case, the peak concentration was 10−5 M and the trough concentration was 10−7 M for each simulated temporal wave in order to obtain a maximum response in acaA− cells (see text). In panels A and B, the instantaneous velocity of each cell is plotted as a function of time. The estimated waves of cAMP are diagrammed at the top of each plot. Velocity above an arbitrary threshold line drawn from 4 to 2 μm is shown in blue to accentuate the time of velocity surges in response to the second, third, and fourth waves. In the difference pictures in panels C through H, expansion zones are shown in green and contraction zones are shown in red. Note the differences in the front of the wave between the control (C) and acaA− (F) for cell shape and lateral pseudopod formation.

