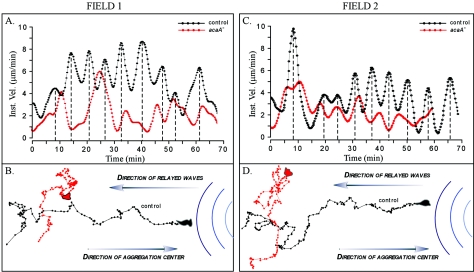
FIG. 6.
acaA− cells do not respond normally to natural waves of cAMP relayed through an aggregation territory of predominantly control (JH10) cells in a mixture of mutant and control cells in a ratio of one to nine, respectively. acaA− cells (red) were vitally stained with DiI. Control cells (black) were unstained. (A and C) Instantaneous velocity of control (JH10) and acaA− cells, in close proximity in two different aggregation fields, responding to sequential waves of cAMP in natural aggregation territories. (B and D) Centroid tracks of the control (JH10) and acaA− cell responding to sequential waves of cAMP relayed through the fields in the respective aggregation territories. The instantaneous velocity plots of control and mutant cells were smoothed with Tukey windows of 5, 15, 60, 15, and 5. Note that the velocity surges of acaA− cells occurred but were more erratic than those of the control cells in close proximity (A and C) and that acaA− cells made no net progress towards the aggregation center, the source of the natural waves (B and D).

