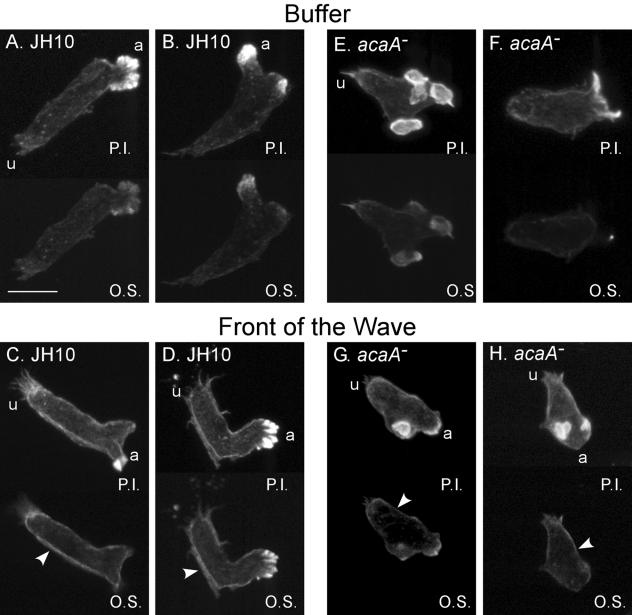
FIG. 7.
The staining patterns of F-actin reveal normal cortical localization in acaA− cells in response to the front of the wave. Control (JH10) and acaA− cells were stained with Oregon green-phalloidin in buffer and in the front of the third in a series of four temporal waves of cAMP. Cells were analyzed by laser scanning confocal microscopy. a, anterior end of cell; u, uropod; P.I., projection image of the entire stack of optical sections from laser scanning confocal microscopy; O.S., optical section 1 μm above the substratum. The increase in cortical staining is noted in optical sections by arrowheads in panels C, D, G, and H. Scale bar, 5 μm.

