
Figure 4.
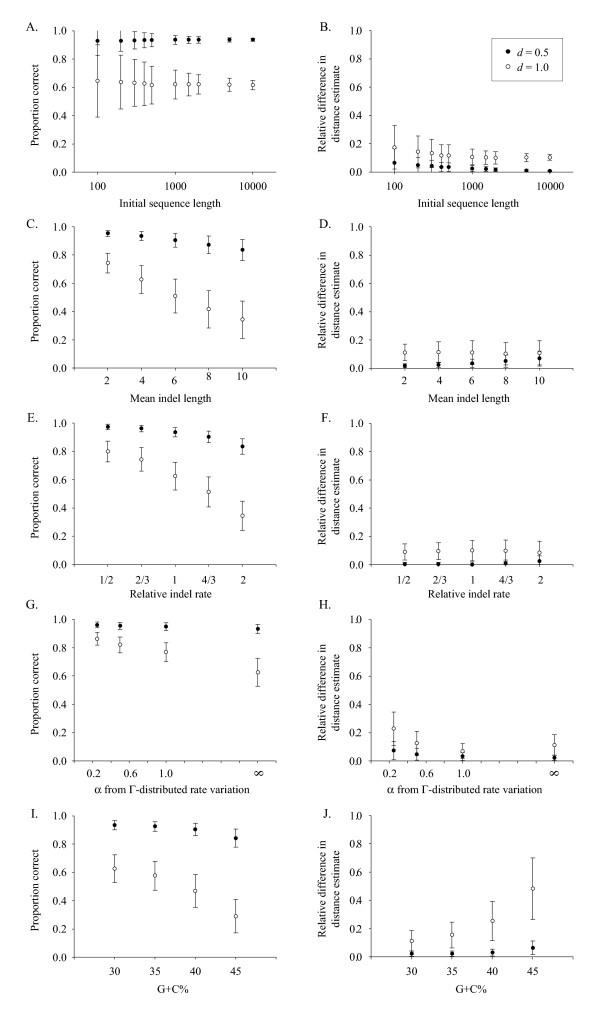
Effects of parameter changes on alignment accuracy and relative error in evolutionary distance estimation. Ordinate axes are scaled to match Figure 3. Alignment accuracy (A, C, E, G, &I) and evolutionary distance estimation (B, D, F, H, &J). (A &B) Effect of initial sequence length. (C &D) Effect of mean insertion and deletion size. (E &F) Effect of insertion and deletion rate. (G &H) Effect of intersite rate variation. (I &J). Effect of nucleotide frequency bias (G+C content). Error bars represent ± one standard deviation. Black and white points represent HKY simulations with expected distances of 0.5 and 1.0, respectively.