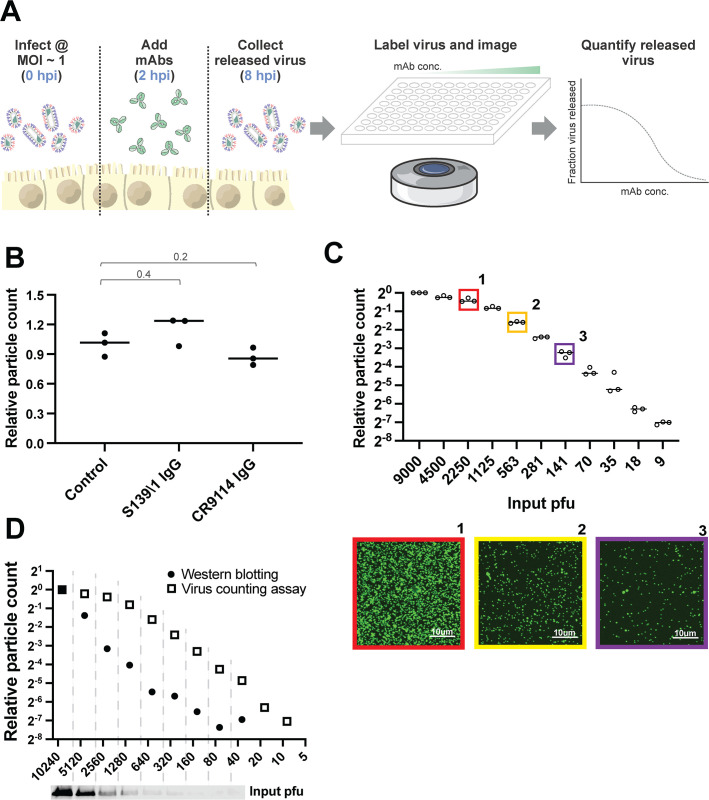
Fig 1.
Measuring antibody inhibition of virus release by counting virions. (A) Overview of the image-based assay to measure antibody inhibition of virus release. Cells are infected with influenza viruses at MOI ~1 and incubated with monoclonal antibodies (mAbs) begining at 2 hpi. Released virions are collected from the supernatant at 8 hpi, labeled with fluorescent anti-HA single-chain antibody fragments or Fabs that bind to non-competing epitopes relative to the test antibodies, and immobilized for imaging. Segmentation of the resulting images enables quantification of released virions. (B) A comparison of virus immobilization on ECL coverslips in the presence or absence of high concentrations of neutralizing antibodies. Antibodies are incubated with virus at a concentration of 60 nM for 30 mins at 4°C before immobilization onto glass-bottom imaging chamber. Data are combined from 3 biological replicates and normalized to the mean of the control conditions. P values are determined by Mann-Whitney tests. (C) Sensitivity and linearity of virus particle counting compared with quantification from plaque assays. Individual data points are from three separate serial dilutions of A/WSN/1933 virus starting from 3 × 10⁵ pfu/mL. Images below are from the indicated conditions in C. Virus particles are visualized using CR9114 scFv labeled with AF488. Contrast in the sample images is exaggerated to show individual virions. (D) Comparison of particle counting results to western blot analysis using an anti-HA antibody to quantify released virus. Results from western blot are collected from one serial dilution; results from the imaging-based assay are collected from three sets of serial dilution, and the mean value is shown. Contrast in the western blot scan is exaggerated to show the HA bands.

