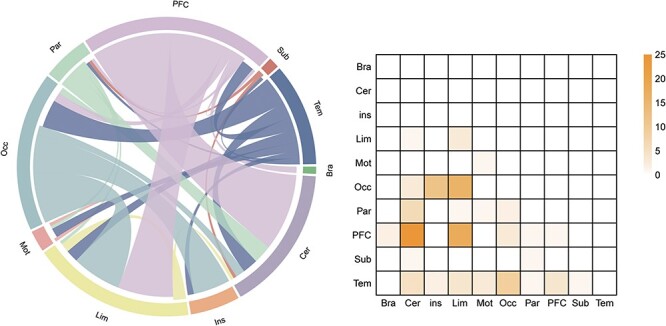
Fig. 3.

Functional connections predicting IAS scores after controlling for head motion, age, gender and negative emotion scores. The left graph shows the connections within and between each macroscale regions. The right graph depicts the connections plotted as number of edges within and between each pair of macroscale regions. PFC, prefrontal cortex; Mot, motor lobe; Ins, insular lobe; Par, parietal lobe; Tem, temporal lobe; Occ, occipital lobe; Lim, limbic lobe; Cer, cerebellum; Sub, subcortical lobe; Bsm, brainstem.
