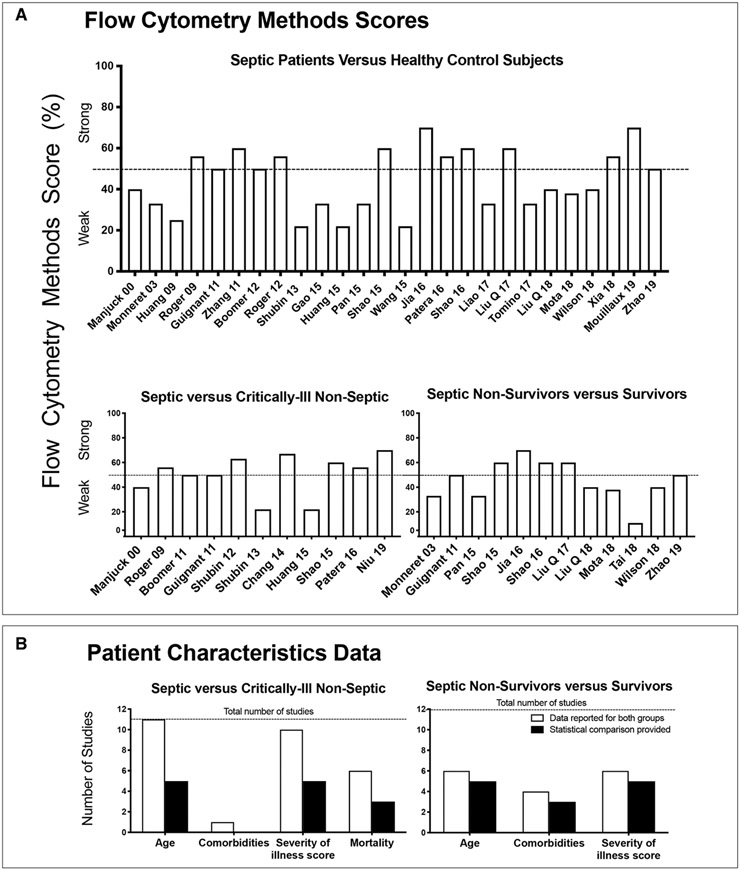
Figure 2.
Study methods and patient characteristics. Flow cytometry methods scores (A) and baseline patient characteristics data (B) for cell-surface checkpoint molecule expression studies comparing septic patients to healthy control subjects or critically ill nonseptic patients or septic nonsurvivors versus survivors. A, Each bar shows for each study noted on the x-axis, the flow cytometry methods score on the y-axis. The score represents the percentage of the number of criteria of the methods score (maximum 8 to 10) a study reported on or employed (see Materials and Methods and Appendix 3 [Supplemental Digital Content 3, http://links.lww.com/CCM/F622] for methods criteria). A score greater than 50% was considered strong. B, Each open bar represents the number of studies that provided the data noted on the x-axis for both study groups (either septic and nonseptic critically ill patients or septic nonsurvivor and survivor), and the closed bar represents the number of studies that provided a statistical analysis comparing these data for these study groups. The horizontal dotted line shows the total number of studies that were reviewed for each patient comparison.

