Abstract
Survival requires the selection of appropriate behaviour in response to threats, and dysregulated defensive reactions are associated with psychiatric illnesses such as posttraumatic stress and panic disorder.1 Threat-induced behaviours, including freezing and flight, are controlled by neuronal circuits in the central amygdala (CeA)2; however, the source of neuronal excitation to the CeA that contributes to high-intensity defensive responses is unknown. Here we used a combination of neuroanatomical mapping, in-vivo calcium imaging, functional manipulations, and electrophysiology to characterize a previously unknown projection from the dorsal peduncular (DP) prefrontal cortex to the CeA. DP-to-CeA neurons are glutamatergic and specifically target the medial CeA, the main amygdalar output nucleus mediating conditioned responses to threat. Using a behavioural paradigm that elicits both conditioned freezing and flight, we found that CeA-projecting DP neurons are activated by high-intensity threats in a context-dependent manner. Functional manipulations revealed that the DP-to-CeA pathway is necessary and sufficient for both avoidance behaviour and flight. Furthermore, we found that DP neurons synapse onto neurons within the medial CeA that project to midbrain flight centres. These results elucidate a non-canonical top-down pathway regulating defensive responses.
In the face of threat, organisms display a continuum of defensive behaviours and flexibly shift between defensive strategies.3,4 Selecting the appropriate action for survival depends on the proximity and intensity of the threat and the context of the encounter.5,6 Moreover, exaggerated responses to perceived threats have been associated with anxiety, post-traumatic stress disorder, panic disorders, and phobias.1,7,8,9 Abnormal patterns of activation in the prefrontal cortex are associated with these disorders, and bidirectional projections between the medial PFC (mPFC) and basolateral amygdala are part of a canonical pathway that has been extensively studied in the acquisition and expression of learned fear measured with freezing.10–14 Previous studies have shown that animals exhibit behavioural scaling to favour flight over freezing in response to a high-intensity threat, and conditional freeze-to-flight shifting is regulated by distinct and mutually inhibitory local circuit motifs in the CeA.2,15,16 Whether the cortex exerts top-down control of these behavioural shifts is not known. Interestingly, the mPFC also projects to the CeA,17 raising the possibility that a direct pathway from mPFC to CeA could influence defensive action selection. However, this pathway has never been defined neuroanatomically, and its role in regulating defensive behaviour is unknown.
Direct mPFC projections to medial CeA
To determine which subdivision of the mPFC projects to the CeA, we injected fluorescent, retrogradely trafficked latex microspheres into the CeA (Fig. 1a,b). We observed sparse projections from both the prelimbic (PL) and infralimbic (IL) cortices. However, a significantly greater number of CeA projectors were located in the dorsal peduncular nucleus (DP; Fig. 1c,d; Extended Data Fig. 1a), a region of the mPFC recently linked to physiological and behavioural responses to stress.18
Figure 1. Neuroanatomical characterization of the DP-to-CeA pathway.
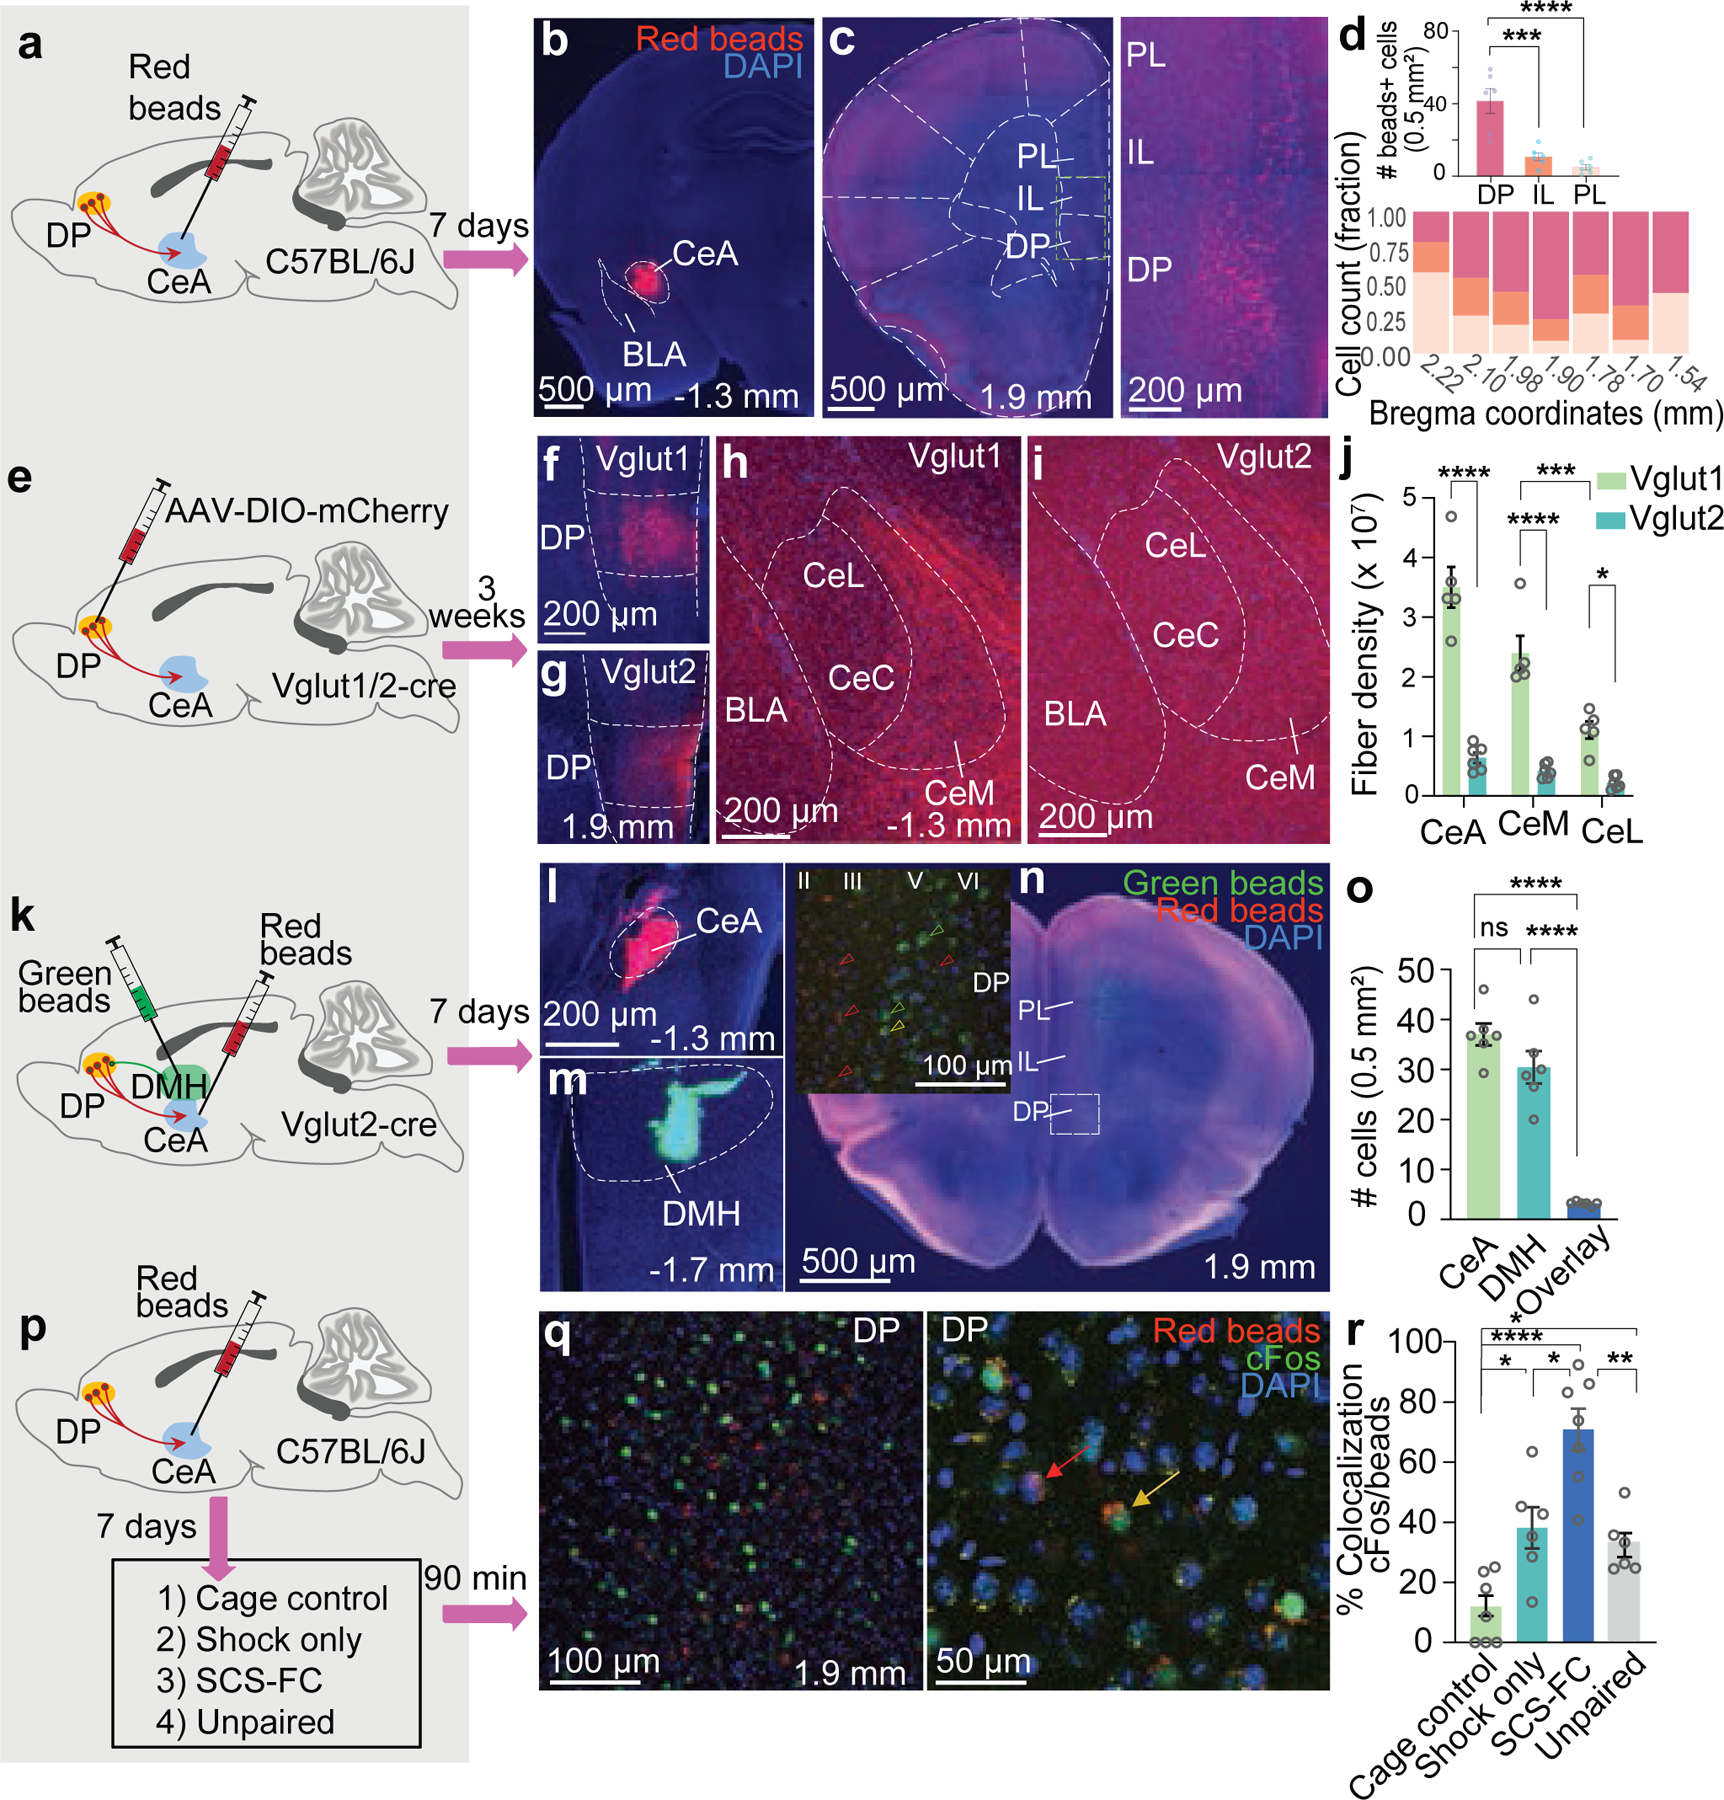
a, Retrograde tracing strategy. b, Representative targeting of red beads in the CeA. c, Representative bead localization in the mPFC (left, 5x, right, 10x). d, Top, Significantly more CeA-projecting neurons are localized in the DP, compared to the IL or PL (One-way ANOVA, F(2,15) = 21.86, p < 0.0001; Bonferroni’s post-hoc test; N = 6 mice). Bottom, Distribution of CeA-projecting neurons along the mPFC antero-posterior axis (N = 6 mice; 4–6 sections/mouse). DP, dorsal peduncular cortex; IL, infralimbic cortex; PL, prelimbic cortex. e, Anterograde tracing strategy. f, Representative image of DP targeting in Vglut1-Cre mice. g, Representative image of DP targeting in Vglut2-Cre mice. h, Representative expression of mCherry+ terminals in the CeA of a VGlut1-Cre mouse. i, Representative expression of mCherry+ terminals in the CeA of a VGlut2-Cre mouse. j, Density of mCherry+ fibres from Vglut1+ (N = 5 mice, 3–4 sections/mouse) and Vglut2+ (N = 6 mice, 2–3 sections/mouse) neurons (unpaired t-test for total CeA, t = 8.89, df = 9, p < 0.0001. Two-way ANOVA, CeM vs CeL, strain X region, F(2,27) = 14.90, p < 0.0001; Bonferroni’s post-hoc test). CeL includes lateral and capsular subregions. k, Dual-target retrograde tracing strategy from CeA and dorsomedial hypothalamus (DMH). l, Representative targeting of CeA. m, Representative targeting of DMH. n, Deposition of green and red beads in the mPFC. Inset, distribution of CeA and DMH projectors in different layers of DP. Red, green, and yellow arrowheads indicate red beads, green beads, and overlay, respectively. o, Number of DP neurons projecting to CeA, DMH, or both (One-way ANOVA, F(2,15) = 62.06, p = 0.0001; Bonferroni’s post-hoc test; N = 6 mice, 3 sections/mouse). p, Strategy for neuronal activation analysis. q, Representative images showing bead+ and/or cFos+ cells in the DP. Left, 10x and Right, 20x. Red arrow, bead+; yellow arrow, bead and cFos+. r, cFos expression in bead+ cells (N = 6 mice for shock only and unpaired, N = 7 mice for cage control and SCS-FC groups; 3–4 sections/mouse; One-way ANOVA, F(3,22) = 22.01, p < 0.0001; Bonferroni’s post-hoc test). Data in d, j, o, r represented as means ± s.e.m. Two-sided statistical tests were used. ****P < 0.0001, ***P < 0.001, **P < 0.01, *P < 0.05.
The mPFC regulates cognition, motivation, and emotion via distinct glutamatergic projections to cortical and subcortical regions.19 The vesicular glutamate transporter (Vglut) 1 is used to label most excitatory cortical neurons, yet the DP is enriched in both the Vglut1 and Vglut2 isoforms, which define different populations of projection neurons.20 To characterize the DP-to-CeA pathway more precisely, we injected a Cre-dependent mCherry vector into the DP of Vglut1- or Vglut2-Cre mice and quantified fibre density in CeA subnuclei (Fig. 1e–g). We found that, while the mCherry+ fibre density within the CeA was significantly higher in Vglut1 mice (Fig. 1h–j), notably, in both Vglut1 and Vglut2 mice, mCherry+ fibres were most abundant in the medial subdivision of the CeA (CeM), as compared to the lateral (CeL) or capsular (CeC) subdivisions (Fig. 1j). Therefore, Vglut1- and 2-expressing DP neurons are anatomically positioned to influence the function of the primary amygdalar output centre controlling the expression of adaptive behaviour.
The DP also projects to the dorsomedial hypothalamus (DMH), a pathway known to regulate sympathetic responses to psychosocial stress.18 To determine whether the DP-to-CeA and DP-to-DMH pathways are discrete, we injected red or green-fluorescent retro-beads into the CeA and DMH (Fig. 1k–m). Both red and green retro-beads were localized in DP cells (Fig. 1n), but the DMH-projecting DP neurons were localized in layers V and VI (90% vs 8.7% in layer II/III), whereas CeA-projecting cells were found mostly in layers II/III (Fig. 1n, inset; Extended Data Fig. 1b, 87% vs 10.5% in layers V and VI). Only a small number of DP cells (~7%) were co-labelled, suggesting that the DP-to-CeA and DP-to-DMH pathways are anatomically distinct (Fig. 1o; Extended Data Fig. 1b).
Given the role of the CeA in defensive response selection and the role of the DP in stress responding,2,18 we hypothesized that threats would activate CeA-projecting DP neurons. To test this, we injected C57BL/6J mice with retro-beads in the CeA and divided animals into four groups: home cage control, footshock-only, unpaired, and fear conditioning (Fig. 1p). The fear conditioning (FC) group was subjected to a protocol we developed that elicits freezing and flight responses to separate components of a serial compound stimulus (SCS-FC; Extended Data Fig. 1d,e).2 Compared to home cage control, shock-only, and unpaired groups, SCS-FC mice displayed significantly greater numbers of retro-bead+ cells co-labelled with cFos (Fig. 1q,r). There were no significant differences in the total number of retro-bead+ cells across the groups, indicating a consistent retrograde labelling efficiency across the experimental groups (Extended Data Fig. 1c).
DP-to-CeA neurons are activated by flight
The significantly elevated expression of cFos in the SCS-FC group suggests that DP-to-CeA neurons are recruited most under conditions that elicit robust cue-induced defensive behaviour. Therefore, we set out to determine the activation patterns of DP-to-CeA projecting neurons during our SCS-FC protocol, which induces escalating intensities of defensive behaviours in a context-specific manner (Extended Data Fig. 1d,e). We used an intersectional approach to selectively express GCaMP6f in DP-to-CeA projection neurons and imaged in-vivo calcium activity in freely moving mice using custom-built open-source miniscopes (Fig. 2a–c). We observed low levels of freezing and no flight before conditioning (Extended Data Fig. 2a–d), with similar levels of neuronal activation to the tone and white noise (WN) components of the SCS (Extended Data Fig. 2e–j; n = 221 neurons from 6 mice). Moreover, there was no correlation between calcium activity and movement speed before conditioning (Extended Data Fig. 2g). Following conditioning, mice exhibited elevated levels of freezing to the tone, and flight to the WN in the conditioning context where footshocks occur (hereafter called the high-threat context; Fig. 2d,e; Extended Data Fig. 3a,b; n = 273 neurons from 6 mice).2,21 By contrast, mice exhibited predominantly freezing when exposed to the same conditioned stimuli in a neutral context where shocks never occur (hereafter called the low-threat context; Fig. 2m,n; Extended Data Fig. 3i,j; n = 176 neurons from 6 mice). Interestingly, as conditioning progressed, the mean activity of CeA-projecting DP neurons increased concurrently, which correlated significantly with speed in the high- but not low-threat context (Extended Data Fig. 3c,k).
Figure 2: DP-to-CeA projecting cells are activated by high fear states.
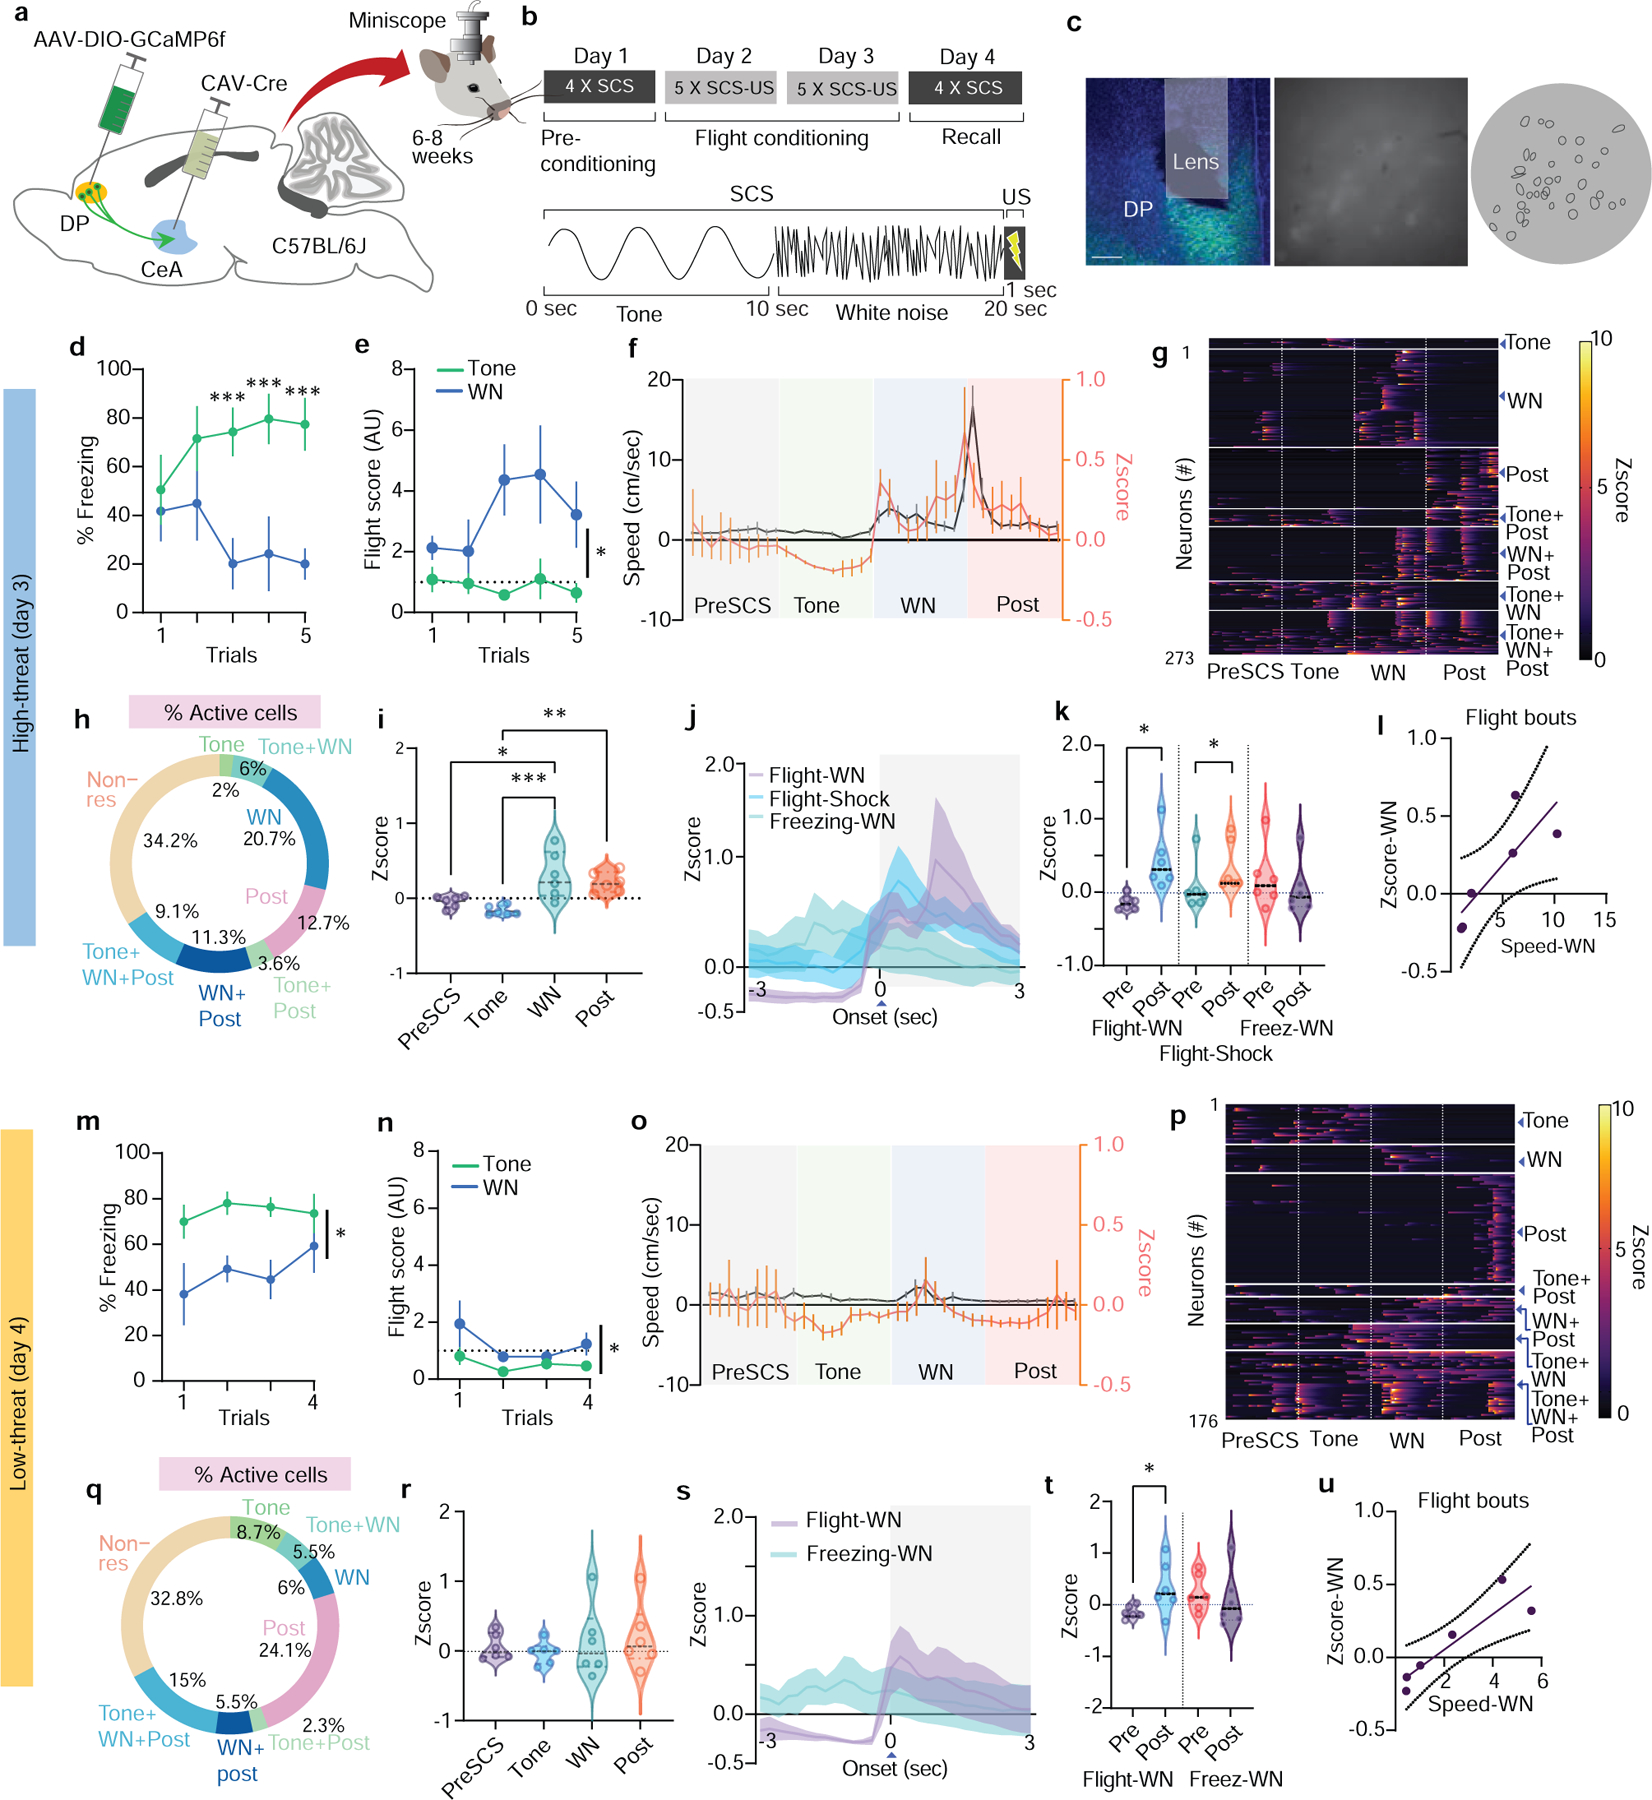
a, Intersectional strategy used to record DP-to-CeA projector activity (N = 6 mice for all panels). b, Mice were subjected to a paradigm designed to elicit conditioned freezing and flight. c, Left, Representative GCaMP6f expression and lens placement (scale bar = 500 μm). Right, miniscope field-of-view (raw and post cell extraction). d, Freezing to cues in the high-threat context. (N = 6 mice; two-way ANOVA, Trial x Stimuli, F(4, 20) = 4.354, p = 0.01, followed by Bonferroni’s post-hoc test). e, Cue-induced flight in the high-threat context. (N = 6 mice; two-way ANOVA, Trial x Stimuli, F(4, 20) = 2.08, p = 0.12, Stimuli, F(1, 5) = 13.49, p = 0.014, Trial, F(4, 20) = 0.933, p = 0.46). f, Population activity and speed from the last trial in the high-threat context (n = 273 cells). g, Neuronal activity of individual neurons during the last trial in the high-threat context (n = 273 cells). h, Percentages of neurons activated during different cue periods in the high-threat context. i, Average neuronal activity from all trials in the high-threat context (n = 273 cells; one-way ANOVA, F(3,20) = 9.33, p = 0.005; Bonferroni’s post-hoc test). j, Neuronal activity aligned at onset of freezing and flight in the high-threat context (n = 273 cells). k, Population activity 3 s before and after the onset of freezing and flight (n = 273 cells; paired t-test flight-WN, t=3.28, df=5; Mann-Whitney test, flight-shock; paired t-test freezing-WN, t=1.778, df=5, p=0.13). l, Spearman correlation of neuronal activity and speed aligned to WN-induced flight bouts (n = 273 cells; r = 0.94, 95% CI = 0.003864 to 0.1503, each point = 1 sec). m, Freezing to cues in the low-threat context (N = 6 mice; two-way ANOVA, Trial x Stimuli, F(3, 15) = 0.5806, p = 0.63, Stimuli, F(1, 5) = 11.73, p = 0.018, Trial, F(3, 15) = 0.83, p = 0.490. n, Cue-induced flight in the low-threat context (N = 6 mice; Two-way ANOVA, Trial x Stimuli, F(3, 15) = 1.58, p = 0.23, Stimuli, F(1, 5) = 8.12, p = 0.035, Trial, F(3, 15) = 1.42, p = 0.27). o, Population activity and speed from the last trial in the low-threat context (n = 176 cells). p, Neuronal activity of individual neurons during the last trial in the low-threat context (n = 176 cells). q, Percentages of neurons activated during different cue periods in the low-threat context. r, Average neuronal activity from all trials in the low-threat context (n = 176 cells; one-way ANOVA, effect of stimuli F(3,20) = 0.39, p = 0.75). s, Neuronal activity aligned to the onset of WN-induced freezing and flight in the low-threat context (n = 176 cells). t, Population activity 3 s before and after the onset of freezing and flight (n = 176 cells; paired t-test flight-WN, t=2.58, df=5; flight-post, t=0.8493, df=5, p = 0.43; freezing-WN, t=0.8493, df=5, p=0.43). u, Spearman correlation of neuronal activity and speed aligned to WN-induced flight bouts (n = 176 cells; r = 0.94, 95% CI = 0.04251 to 0.2010. Each point = 1 sec). Data in d-f, j, m-o, s represented as means ± s.e.m. Violin plots in i, k, r, t indicate median, interquartile range, and the distribution of individual data points. Two-sided statistical tests were used. ***P < 0.001, **P < 0.01, *P < 0.05.
In the high-threat context, the CeA-projecting DP neuronal population was most active during WN and shock (Fig. 2f–i), with many individual DP-to-CeA neurons active specifically during sensory epochs eliciting flight behaviour (WN and post-shock periods, 45% of recorded neurons; Fig. 2g,h; Extended Data Fig. 3g,h). Only 2% of cells encoded the tone (Fig. 2h) and average neuronal activity was significantly higher during WN and post-shock compared to the tone (Fig. 2i). Interestingly, WN-induced activation was diminished in the low-threat context (Fig. 2o), neuronal responses were more evenly distributed across sensory epochs (Fig. 2p,q), and no significant difference was observed between neuronal responses to tone and WN (Fig. 2r; Extended Data Fig. 3o,p). Together, these data suggest that DP-to-CeA neuronal activity is context-dependent and is more associated with sensory stimuli that induce higher-intensity threat behaviour.
To determine if DP-to-CEA projector activity is associated with defensive responses, we analysed neuronal activity around the onset of freezing and flight bouts in both contexts. In the high-threat context, neuronal activity was significantly increased at the onset of flight yet was unchanged in response to freezing (Fig. 2j,k). Neuronal activity was also positively correlated with speed during flight bouts (Fig. 2l; Extended Data Fig. 3d), but not with locomotion surrounding freezing bouts (Extended Data Fig. 3e,f). Flight occasionally occurs in the low-threat context; therefore, we also analysed neuronal responses to flight and freezing onset under these conditions. Just as in the high-threat context, there was a significant increase in activity following flight onset, and a significant correlation between neuronal activation and speed during flight, yet no increase in activity was noted for freezing (Fig. 2s–u; Extended Data Fig. 3l–n).
DP-to-CeA neurons mediate avoidance
The prevalence of DP-to-CeA neurons active in the high-threat context suggests a functional role for this pathway in negative-valence related behaviours. We first tested this idea using chemogenetic manipulations of DP-to-CeA neurons in standard avoidance paradigms used to assay anxiety-like states: the open field test (OFT) and the elevated plus maze (EPM). We used an intersectional targeting strategy to express either inhibitory (hM4Di-mCherry) or excitatory (hM3Dq-mCherry) DREADDs in the DP-to-CeA pathway, with an mCherry group serving as a CNO control (Fig. 3a–c). DREADD-mediated inhibition of the DP-to-CeA pathway increased the time spent and number of entries in the centre zone of the OFT (Fig. 3d,f, and g), as well as increasing the number of entries into the open arm of the EPM (Fig. 3e,i, and j) without affecting the total distance travelled (Fig. 3h). By contrast, chemogenetic stimulation of this pathway did not induce avoidance behaviour in either assay. These findings suggest that the DP-to-CeA pathway is necessary but not sufficient for innate avoidance behaviour.
Figure 3: Chemogenetic inhibition of DP-to-CeA pathway reduces avoidance.
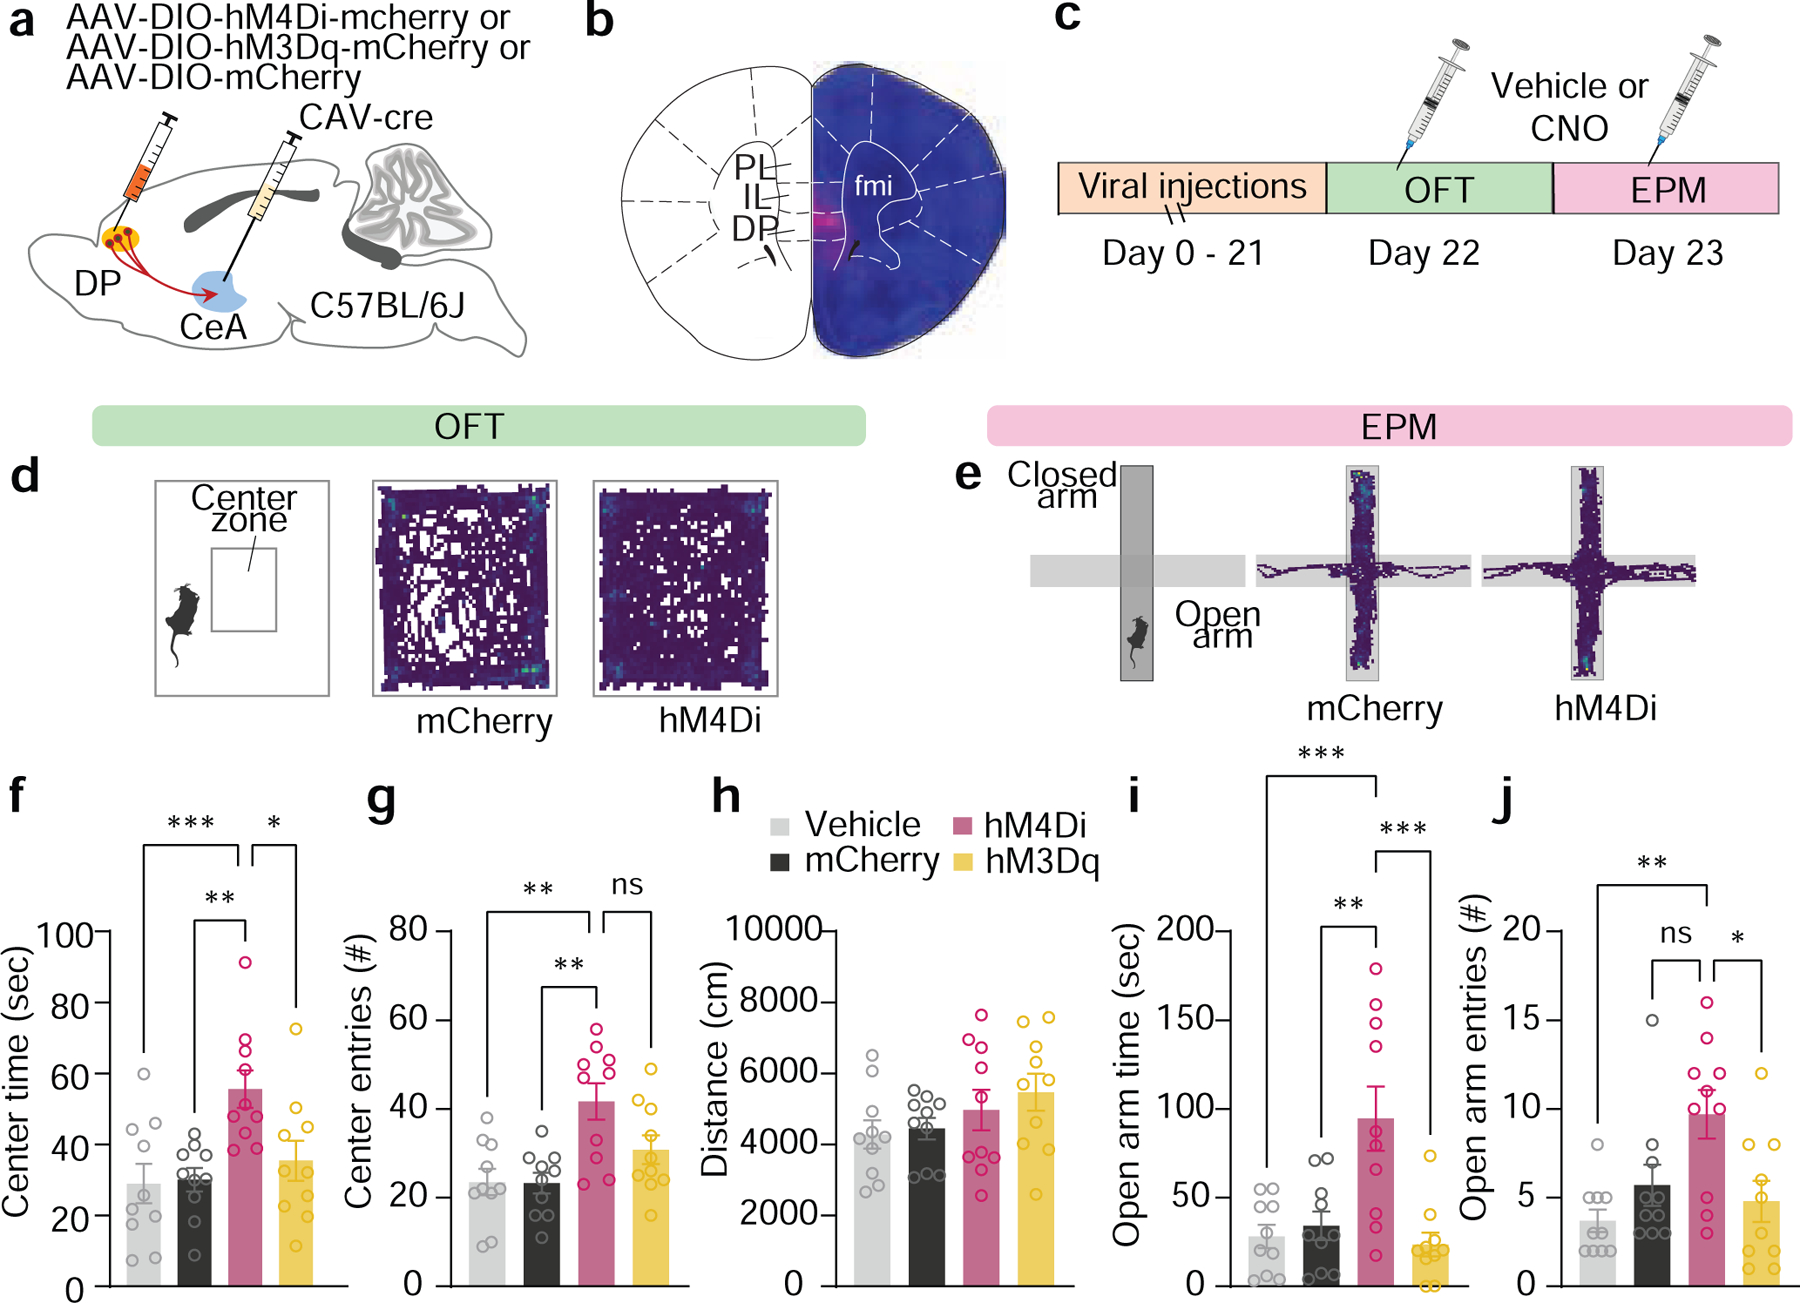
a, Intersectional strategy used for chemogenetic manipulation of the DP-to-CeA pathway. b, Representative mCherry expression in the DP (scalebar = 500 μm). c, Mice from control (DREADD + vehicle, N = 10; mCherry + CNO, N = 10 for f-j) and DREADD groups (hM4Di-mCherry, N = 10; hM3Dq-mCherry, N = 10 for f-j) were subjected to the OFT and EPM 30 min after CNO (5 mg/kg) or vehicle injection. d, Representative OFT activity plots of mCherry + CNO and hM4Di + CNO mice. e, Representative EPM activity plots of mCherry + CNO and hM4Di + CNO mice. f, Inhibition of the DP-to-CeA pathway significantly increased time spent in the centre zone (One-way ANOVA, F(3,36) = 6.06, p = 0.001; Bonferroni’s post-hoc test). g, Inhibition of the DP-to-CeA pathway significantly increased the number of entries in the centre zone (One-way ANOVA, F(3,36) = 7.158, p = 0.0007; Bonferroni’s post-hoc test). h, DREADD manipulations did not alter distance travelled in the OFT (One-way ANOVA, F(3,36) = 1.36, p = 0.270). i, Inhibition of the DP-to-CeA pathway significantly increased open-arm time in the EPM (One-way ANOVA, F(3,36) = 9.22, p = 0.0001; Bonferroni’s post-hoc test). j, Inhibition of the DP-to-CeA pathway significantly increased open-arm entries in the EPM (One-way ANOVA, F(3,36) = 5.47, p = 0.003; Bonferroni’s post-hoc test). Data in f-j represented as mean ± s.e.m. Two-sided statistical tests were used. ***P < 0.001, **P < 0.01, *P < 0.05.
DP-to-CeA neurons mediate flight
To study the necessity of the DP-to-CeA pathway in other forms of defensive behaviour, we performed optogenetic loss-of-function studies in the OFT and SCS-FC (Fig. 4a–f; Extended Data Fig. 4). We injected a Cre-dependent vector carrying eNpHR or EYFP control into the DP, and a retrograde CAV2-Cre vector into the CeA of C57BL/6J mice (Fig. 4a; Extended Data Fig. 4a). Inhibition of DP-to-CeA terminals significantly increased the time spent in, and number of entries into, the centre zone of the OFT, but did not affect locomotor activity, consistent with chemogenetic inhibition (Extended Data Fig. 4c–e). We then used a within-subjects experimental design in the SCS-FC paradigm, with optogenetic stimulation during half of the trials (Extended Data Fig. 4b). In the high-threat context, inhibition of DP-to-CeA terminals significantly reduced WN-induced flight (Fig. 4e; Extended Data Fig. 4g,h). Interestingly, inhibiting these terminals reduced freezing to the tone in the eNpHR group, yet also elevated freezing during the WN period, demonstrating cue-specific reduction in defensive response intensity but not a complete inhibition of fear (Fig. 4d; Extended Data Fig. 4f).22,23. Optogenetic inhibition had no effect on defensive behaviour in the low-threat context (Fig. 4f; Extended Data Fig. 4i–k), further supporting the context-dependent function of the DP-to-CeA pathway.
Figure 4. Optogenetic modulation of the DP-to-CeA pathway regulates flight.
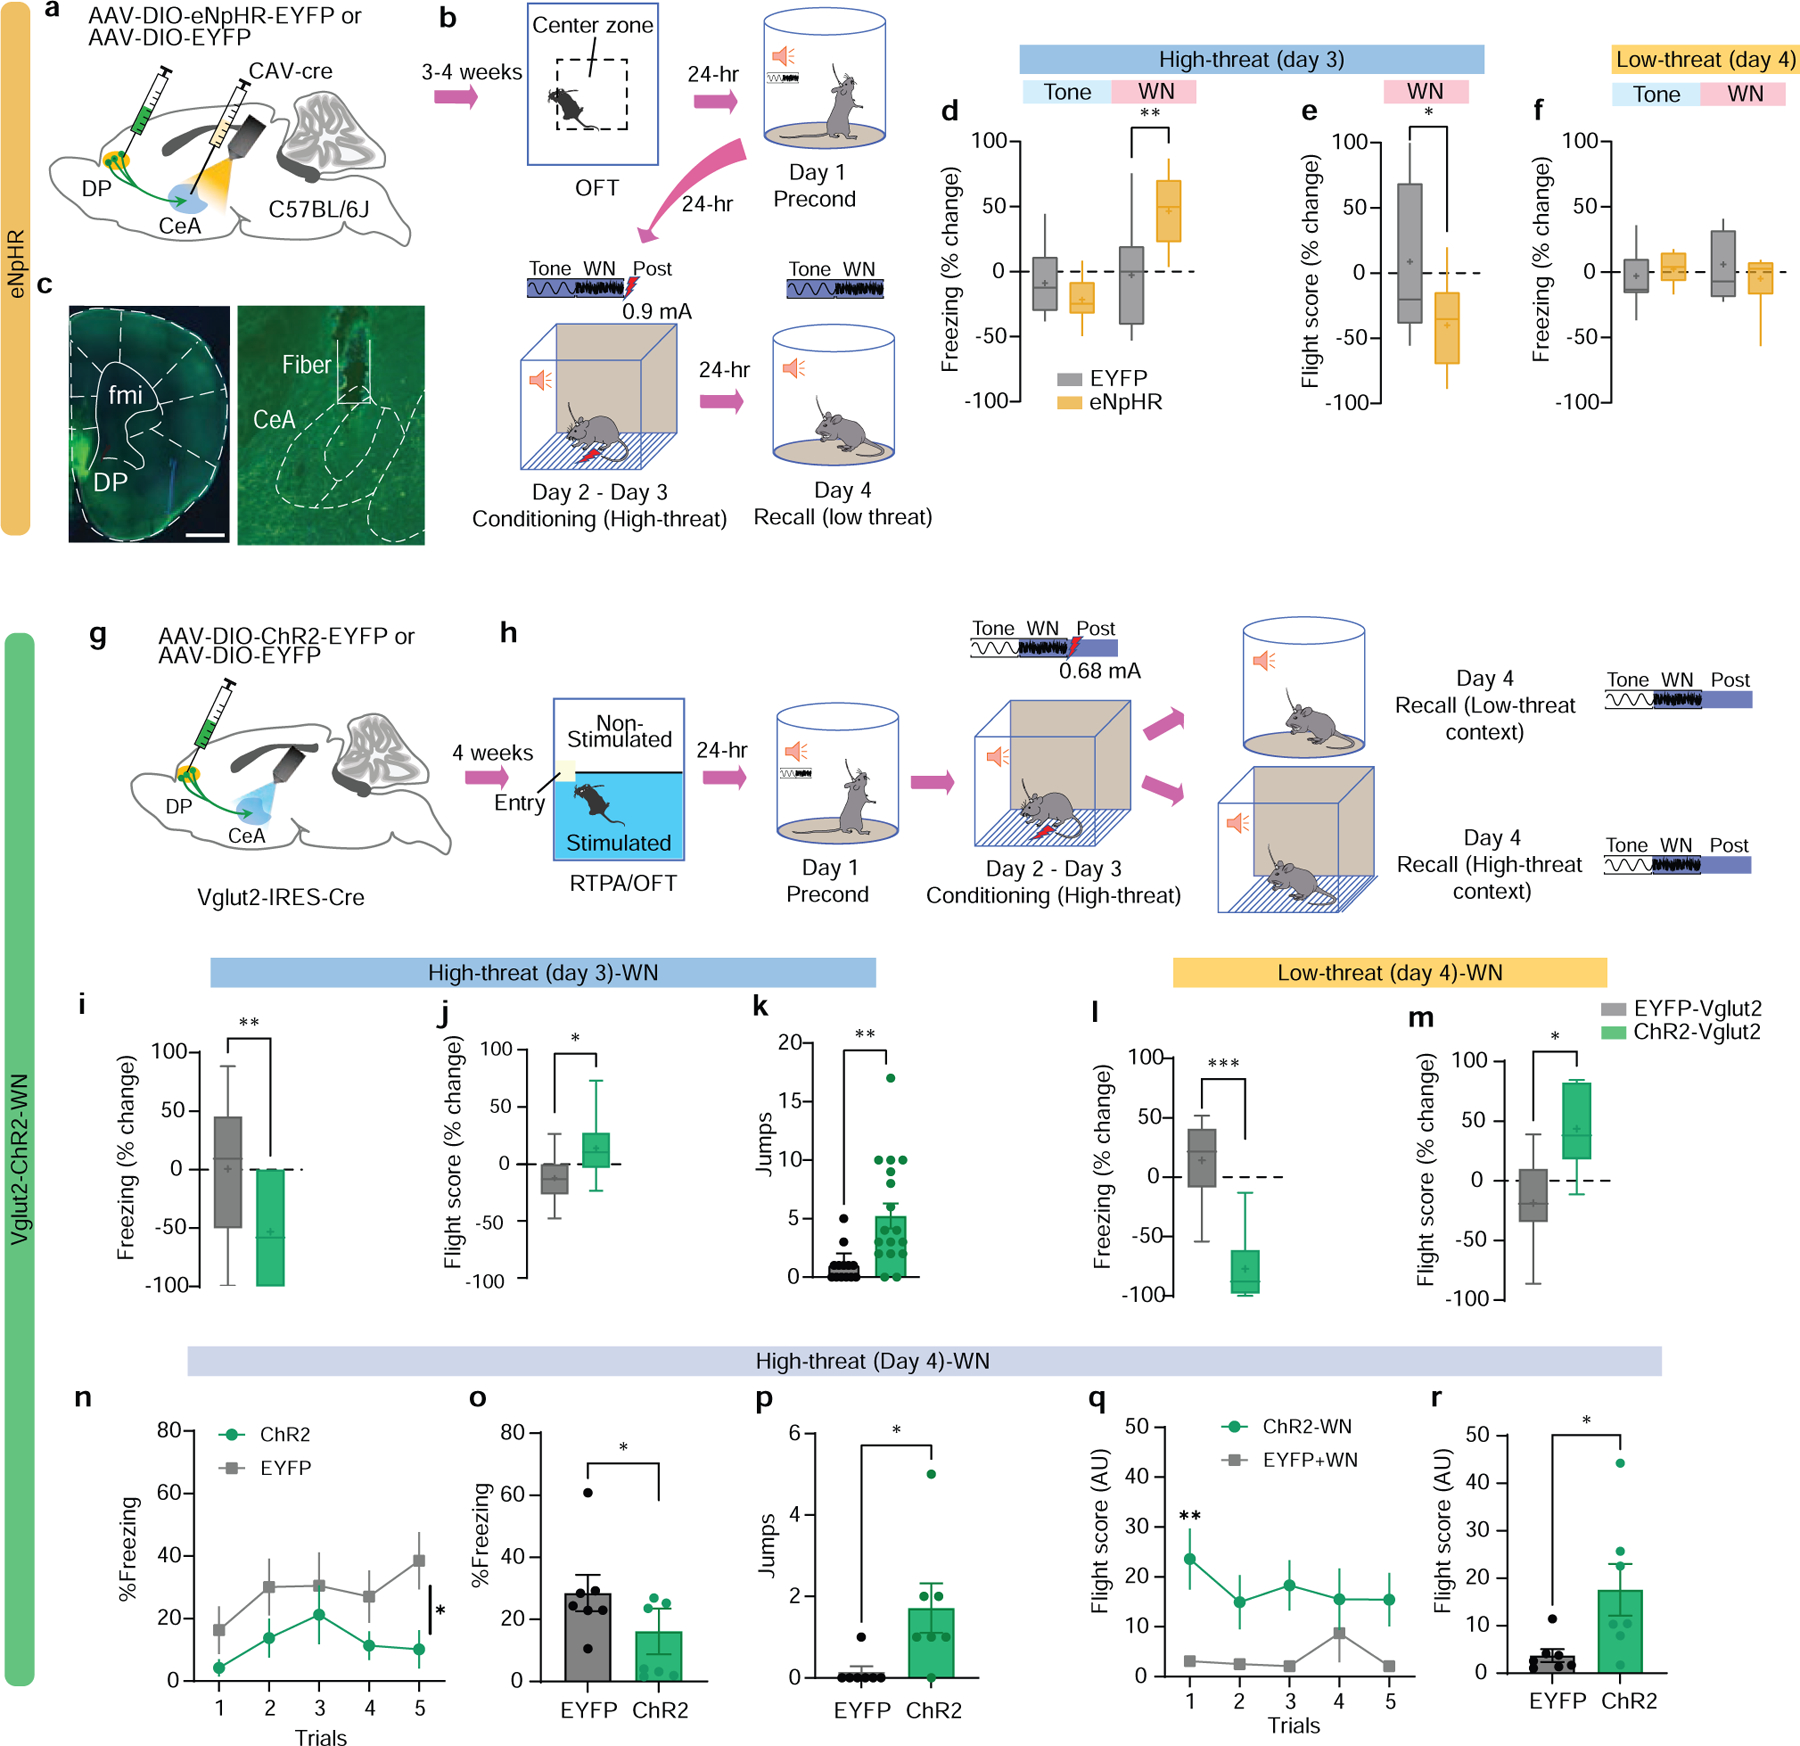
a, Intersectional targeting strategy for optogenetic inhibition of the DP-to-CeA pathway. b, Experimental timeline for optogenetic inhibition experiments. c, Representative images of eNpHR-EYFP expression in DP and fibre stub placement in CeA (scalebar = 500 μm). d-e, Effect of optogenetic inhibition in EYFP (N = 9) and eNpHR (N = 9) groups on d, freezing (LED-on vs LED-off) in the high-threat context (EYFP vs eNpHR, unpaired t-test) and e, flight scores (LED-on vs LED-off) in the high-threat context (EYFP vs eNpHR, unpaired t-test). f, Effect of optogenetic inhibition in EYFP (N = 9) and eNpHR (N = 9) groups on freezing (LED-on vs LED-off) in the low-threat context (EYFP vs eNpHR, Mann-Whitney, n.s.). g, Viral injection strategy for optogenetic stimulation of the DP-to-CeA pathway. h, Experimental timeline for optogenetic stimulation experiments. i-k, Effect of optogenetic stimulation in EYFP (N = 13) or ChR2 (N = 17) groups on i, freezing (LED-on vs LED-off; Mann-Whitney), j, flight scores (LED-on vs LED-off; unpaired t-test, t=2.262, df=28), and k, escape jumps (Unpaired t-test, t=3.383, df=28) in the high-threat context. l-m, Effect of optogenetic stimulation in EYFP (N = 6) and Vglut2-ChR2 (N = 10) groups on l, freezing (LED-on vs LED-off; unpaired t-test, t=5.046, df=14) and m, flight scores (LED-on vs LED-off; unpaired t-test, t=2.845, df=14) in the low-threat context. n-r, Effects of optogenetic stimulation in EYFP (N = 7) and Vglut2-ChR2 (N = 7) groups during recall in the high-threat context on n, Trial-wise freezing (two-way ANOVA, Group x trial, F(4, 48) = 0.644, P=0.633, main effect of Group, F (1,12) = 4.874, P=0.0475), o, Average freezing (unpaired t-test, t=2.208, df=12), p, Escape jumps (unpaired t-test, t=2.524, df=12), q, Trial-wise flight scores (two-way ANOVA, Trial x Group, F(4, 48) = 2.738, P=0.0393; Bonferroni’s multiple comparisons test), and r, Average flight scores (unpaired t-test, t=2.462, df=12). Box and whisker plots in d-f, i-j, l-m indicate median, interquartile range, and min. to max. of the distribution, crosses indicate means. Data in k, n-r represented as mean ± s.e.m. Two-sided statistical tests were used. ***P < 0.001, **P < 0.01, *P < 0.05.
To study the sufficiency of the DP-to-CeA pathway in mediating flight, anxiety, and aversive behaviour, we performed optogenetic gain-of-function studies (Fig. 4g–r; Extended Data Figs. 5–8). Optogenetic activation of DP-to-CeA terminals using a non-cell type specific intersectional approach (Extended Data Fig. 5a) did not elicit significant changes in negative valence behaviours (Extended Data Fig. 5b–j). Stimulation of DP terminals in the CEA expressing ChR2 under the control of a CaMKIIa promoter (Extended Data Fig. 6a) elicited a significant avoidance response (Extended Data Fig. 6b,c); however, there was no significant effect on freezing and flight responses in either threat context (Extended Data Fig. 6d–c).
The lack of effect of these manipulations on defensive behaviour could be due to functional heterogeneity in the DP-to-CEA pathway (Fig. 1j). Therefore, we separately targeted the Vglut1+ and Vglut2+ subpopulations and stimulated axon terminals in the CEA (Fig. 4g; Extended Data Figs. 7,8). Stimulation of Vglut1+ terminals induced real-time place preference (Extended Data Fig. 7b,c), and a reduction in cue-induced freezing (Extended Data Fig. 7d,f), but it had no effect on conditioned flight responses (Extended Data Fig. 7e,g). However, optogenetic activation of Vglut2+ terminals in the CeA (Extended Data Fig. 8a,b), induced significant place avoidance (Extended Data Fig. 8c), and a significant decrease in the number of centre entries in the OFT (Extended Data Fig. 8d,e). Stimulation of Vglut2+ terminals also significantly reduced freezing (Fig. 4i,l; Extended Data Fig. 8f,i), and significantly elevated flight responses in both contexts (Fig. 4j,k, and m; Extended Data Fig. 8g,h, and j).
We next tested the effects of Vglut2+ terminal stimulation on flight responses in the high-threat context in the absence of footshock (Fig. 4n–r). Optogenetic stimulation during WN significantly reduced freezing (Fig. 4n,o), and increased flight responses (Fig. 4p–r). Together, these data demonstrate that the DP-to-CeA pathway is necessary and sufficient for conditioned flight responses.
DP neurons control CeM outputs to the PAG
To investigate how DP neurons might impact flight behaviour via the CeM, we first asked whether DP-to-CeA projections differentially innervate genetically defined cell types in the CeM that are known to mediate defensive behaviour in the CeL2 (Extended Data Fig. 9a–i). There were many labelled terminals near both somatostatin (SOM)+ and corticotrophin releasing hormone (CRH)+ somata in the CeM (Extended Data Fig. 9b), and DP fibre stimulation resulted in a strong induction of either a monophasic inward synaptic current or a biphasic inward/outward synaptic current in both SOM+ and CRH+ neurons in the CeM (Extended Data Fig. 9d,f, and i), but not in the CeL (Extended Data Fig. 9e,h). These optogenetically-evoked responses were blocked by bath application of the AMPA receptor antagonist DNQX (Extended Data Fig. 9g). These findings confirm the presence of functional glutamatergic DP projections to the CeM but also suggest that this pathway controls flight behaviour via a mechanism distinct from that which was previously described in the CeL.
CeM output neurons can be classified by their action potential firing properties,24–26 with distinct subclasses influencing behavioural threat responding via their projections to known targets within the periaqueductal gray (PAG).26–28 In particular, burst firing and regular firing neurons innervate the dorsolateral and lateral columns of the PAG (dl/l PAG) involved in flight responses.26,29,30 We tested if DP innervation targeted physiologically defined CeM neuronal populations. We classified DP-excited CeM neurons as regular spiking, bursting, or late-firing (Fig 5a–c; Extended Data Fig. 9j). Optogenetic stimulation of DP terminals in the CeA primarily evoked EPSCs in burst firing and regular firing neurons, while late-firing neurons were only rarely excited (Fig. 5c), suggesting that the DP excites CeM projections to PAG columns linked to flight behaviour.
Figure 5. DP-to-CeA neurons exert excitatory control over CeM projections.
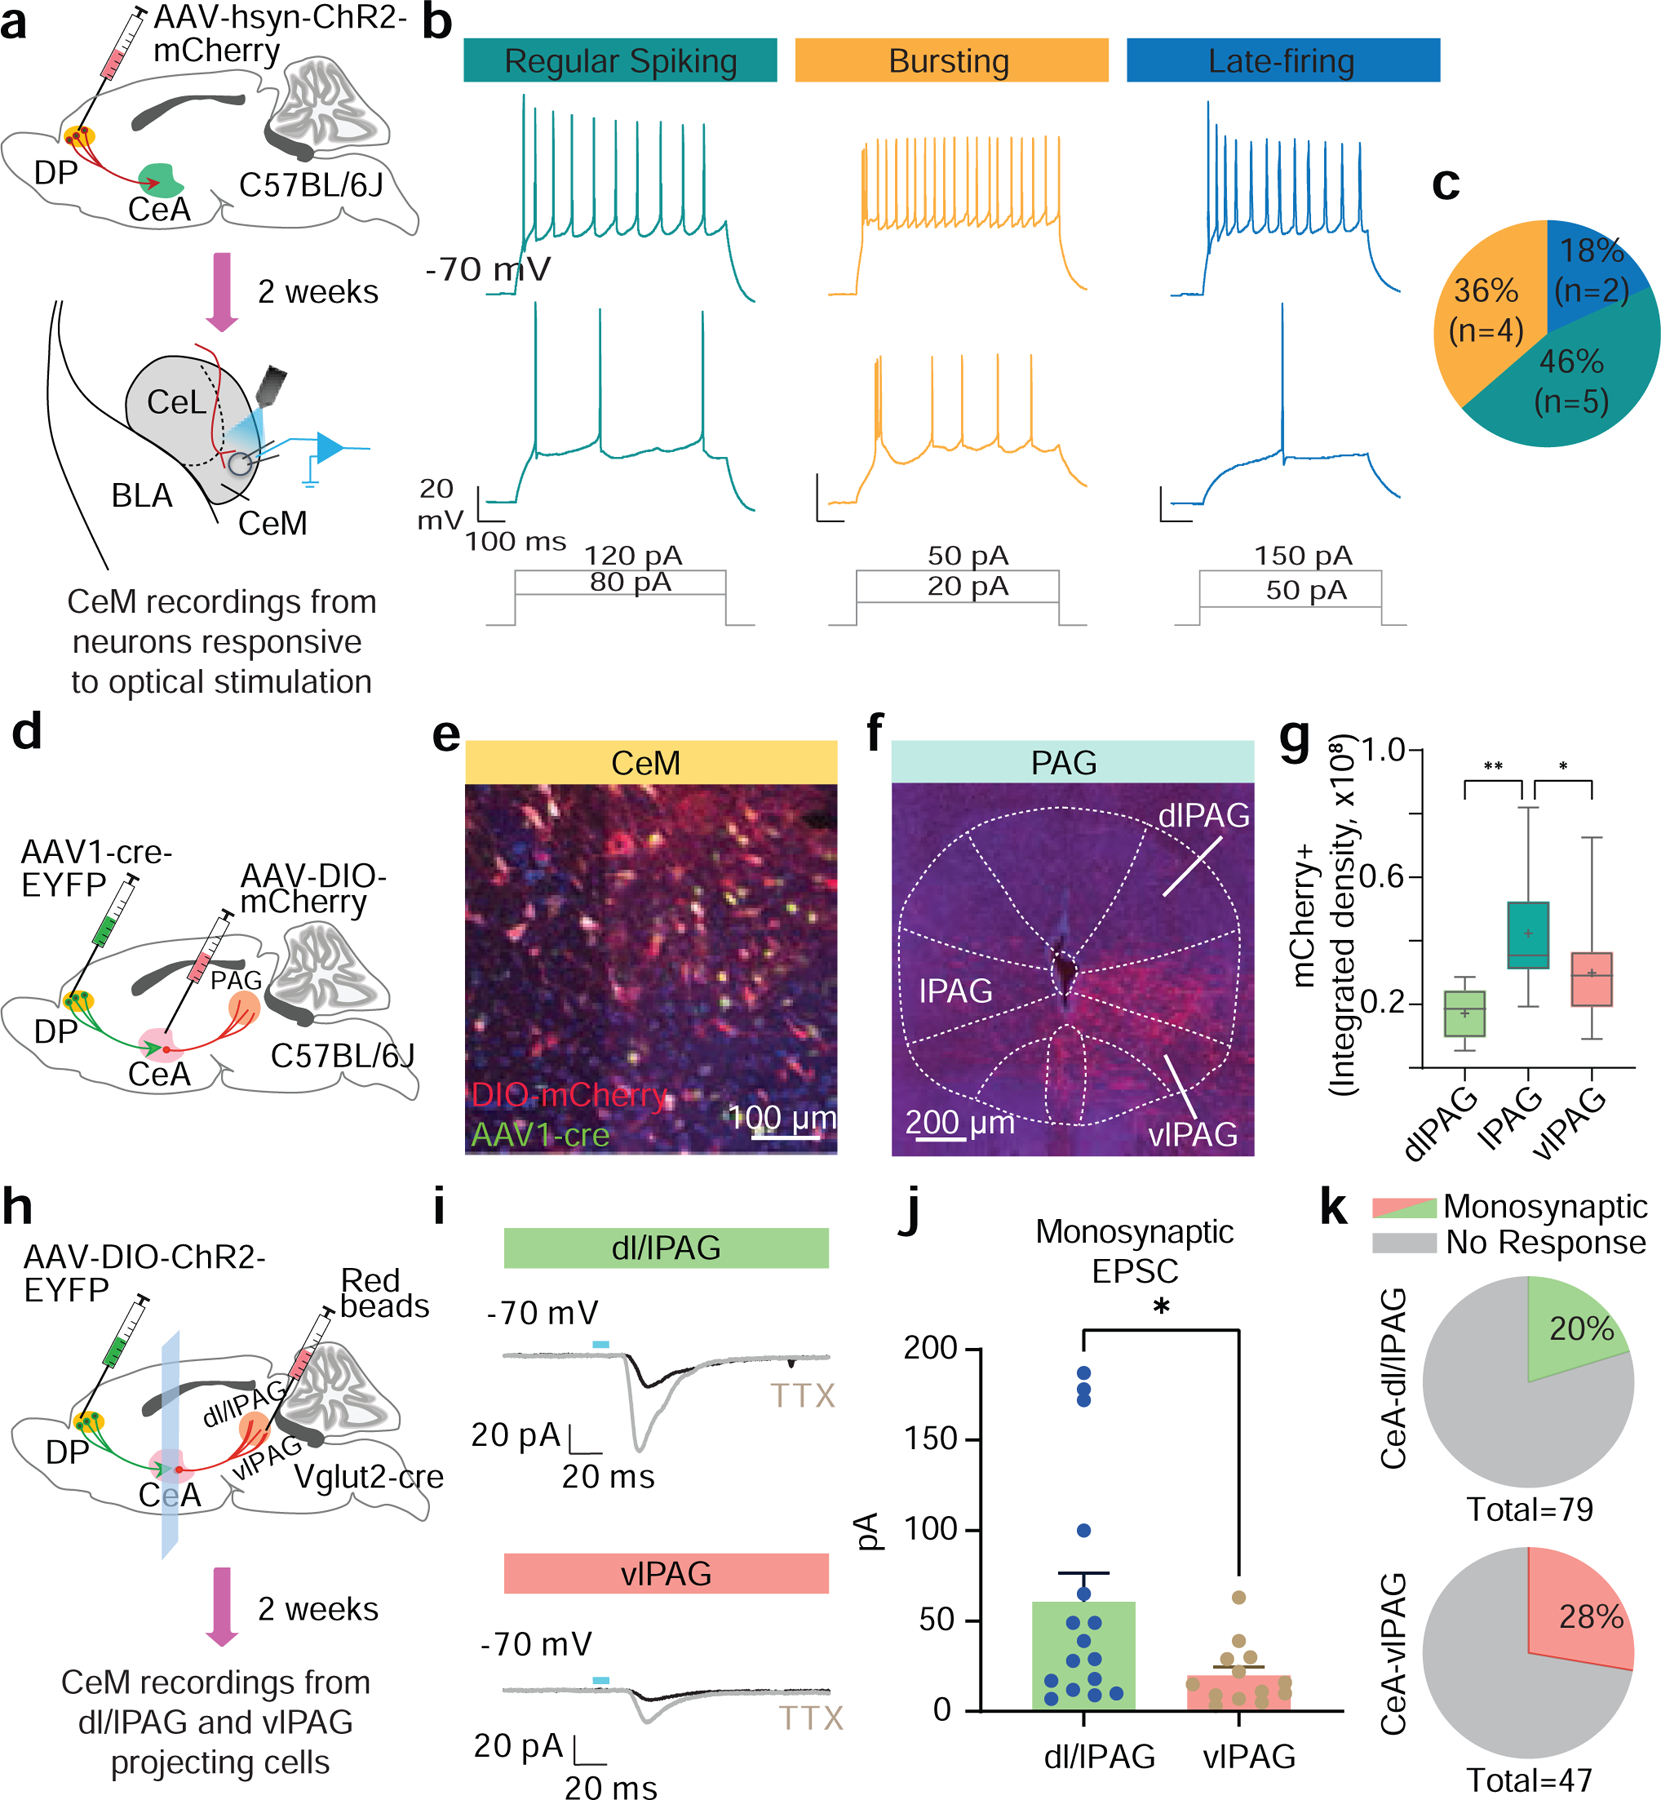
a, Injection targeting and recording strategy. b, Representative firing patterns evoked by depolarizing current injection in CeM neurons innervated by DP projections. DP innervation was confirmed by postsynaptic responses to optogenetic stimulation of ChR2+ axons in CeM (data not shown). c, Proportion of DP-excited CeM neurons classified by firing patterns (N = 11 cells from 4 mice). d, Viral targeting strategy used to map the PAG-projecting CeM neurons innervated by DP. e, Representative image showing expression of EYFP (green) and mCherry (red) in the CeM. f, Representative image showing mCherry+ terminals in PAG subregions. g, Morphometric analysis showing that lPAG contains significantly greater mCherry+ terminals (N = 3 mice; RM one way-ANOVA, F(2,36) = 12.50, P = 0.0006; Bonferroni’s multiple comparison test). Box and whisker plots indicate median, interquartile range, and crosses indicate means. h, Schematic of targeting and recording strategy. i, Representative evoked synaptic responses in dl/lPAG- (top) and vlPAG-projecting (bottom) CeM cells by photostimulation of DP axonal fibres and TTX application. j, Amplitude of evoked monosynaptic EPSCs was significantly higher in dl/lPAG (N = 16 cells from 10 mice) as compared to vlPAG (N = 13 cells from 7 mice) projecting CeM neurons (Mann Whitney test, *p = 0.0367). Data represented as mean ± s.e.m. k, Proportion of CeM neurons with evoked EPSCs, classified by their projection target. Two-sided statistical tests were used. **P < 0.01, *P < 0.05.
To directly test this hypothesis, we first labelled the neuroanatomical pathway by injecting an anterograde transneuronal AAV1-Cre vector into the DP region and a Cre-dependent mCherry-expressing vector into the CeM (Fig. 5d). This approach revealed numerous targets of CeM neurons receiving DP innervation (Extended Data Fig. 10). Quantifying the projection topography of the labelled CeM neurons in the PAG revealed that the lateral PAG, known to regulate flight,28 had the highest density of mCherry+ fibres (Fig. 5e–g). We then labelled CeM projection neurons to different columns of the PAG and performed whole cell patch clamp recordings while optogenetically stimulating Vglut2+ DP afferents in CeM (Fig. 5h; Extended Data Fig. 10a–c). We observed that CeM projections to the dl/l PAG have larger monosynaptic excitatory currents than projections to the vlPAG in response to stimulation of DP terminals (Fig. 5i,j), despite there being no preferential innervation bias between the projection pathways (Fig. 5k). These data support the hypothesis that the DP promotes flight through excitation of CeM output neurons to columns of PAG known to be important for flight behaviour.
Discussion
Here, we define the function of a novel top-down pathway from the DP region of the mPFC directly to the CeA in the control of defensive behaviour. This non-canonical corticolimbic pathway is distinct from the well-studied reciprocal pathway between the prelimbic and infralimbic cortices and the basolateral amygdala and is activated in high-threat situations. Glutamatergic DP neurons exert their influence on defensive behaviour via projections to the CeM, the amygdala output nucleus known for coordinating complex responses to threats. These findings have important implications for understanding the basic neurobiology of threat processing.
The DP contains populations of Vglut1+ and Vglut2+ glutamatergic neurons. We found that both populations innervate the CeM, and our optogenetic experiments revealed that excitation of Vglut1+ terminals in the CeM elicits positive valence behaviour while excitation of Vglut2+ terminals elicits avoidance and flight. Our electrophysiology data suggest that the effects on flight are mediated through DP-mediated excitation of CeM neurons projecting to the PAG. How the Vglut1+ DP population exerts its appetitive effects in the CeM is still to be determined (see Supplementary Discussion).
Collectively, this study adds to a growing body of literature defining the CeA as a vital limbic brain structure that integrates complex sensory information to generate survival behaviour.23,31–33 It has been demonstrated that CeL circuit activity is regulated by local recurrent inhibitory interactions,2,34,35 and this mutual inhibition motif is important for rapid action selection. Future studies should investigate whether a similar “winner-take-all” motif is used in the CeM to select between freezing versus flight responses.
CeM output neurons control freezing through projections to the PAG,28,36,37 and our results demonstrate that the CeM is also important for flight. We found that DP-to-CeA projections target specific classes of CeM neurons that project to regions of the PAG traditionally implicated in flight26, with weaker Vglut2+ inputs to the vlPAG, which is linked to freezing.28. It should be noted that the lPAG can elicit both freezing and flight, and defensive action selection in this region depends on numerous factors, including stimulation strength and neuronal identity38–40 The current study supports the idea that top-down integration of information in the lPAG from the DP-to-CeM pathway contributes to defensive action selection to threat.41,42 How this circuit ultimately influences PAG circuits to induce flight should be a topic of future investigation.
Learned fear is traditionally assayed using freezing, control of which involves the well-established mPFC-basolateral amygdala-CeA pathway.43 Previous research has shown that IL projections to the basolateral amygdala and intercalated cell masses effectively operate to inhibit fear by supporting fear extinction.44,45 In contrast, the DP-to-CeA pathway defined here operates under high-threat conditions and is necessary for generating flight. The context- and cue-specificity of DP-to-CeA activation and function is consistent with the known role of context and salience in defensive action selection.46–48 Our findings therefore implicate the importance of the mPFC in executive control over high-intensity fear responses and may lead to a better understanding of the cortical dysfunction observed in PTSD and panic disorder.14
Methods
Animals
Male and female C57BL/6J (Stock No: 000664, Jackson laboratories, USA), CRH-IRES-Cre (Stock Number: 012704), SOM-IRES-Cre (Stock No: 013044), Vglut1-IRES-Cre (Slc17a7-IRES2-Cre-D, Stock No: 023527) and Vglut2-IRES-cre (Stock Number: 028863) mice aged 5–12 weeks were used. All Cre-driver lines were fully backcrossed to C57BL/6J. Mice were individually housed on a 12-hr light/dark cycle with ad libitum food and water (average room temperature = 70–72 degrees F; humidity = 50–60%). Behavioural experiments were performed during the light phase. Implanted animals were habituated to handling by cupping the mouse in hand for 5 minutes/day for 2 days before the start of the experiment. All animal procedures were performed following institutional guidelines and were approved by the Tulane University Institutional Animal Care & Use Committee.
Viral vectors
For optogenetic experiments we used AAV5-EF1a-DIO-hChR2(H134R)-EYFP-WPRE-HGHpa (Addgene 20298), AAV5-hSyn-hChR2(H134R)-mCherry (Addgene 26976), AAV5-EF1a-DIO-eNpHR3.0-EYFP (Addgene 26966), and AAV5-EF1a-DIO-EYFP (Addgene 27056, all gifts from Karl Deisseroth). For chemogenetics, we used AAV5-hSyn-DIO-hM3D(Gq)-mCherry (Addgene 44361), AAV-hSyn-DIO-hM4D(Gi)-mCherry (Addgene 44362), and AAV5-hSyn-DIO-mCherry (Addgene 50459, all gifts from Bryan Roth). For Cre-dependent GCaMP6f expression, we used AAV5-CAG-Flex-GcaMP6f-WPRE-SV40 (Addgene 100835, a gift from Douglas Kim & GENIE Project). To retrogradely express Cre, we used CAV2-Cre (PVM, France).49 For neuronal tracing and cell labeling experiments we used AAV5-hSyn-DIO-mCherry (Addgene 50459, a gift from Bryan Roth) and AAV5-EF1a-DIO-EYFP (Addgene 27056, a gift from Karl Deisseroth) and pENN.AAV.hSyn.HI.eGFP-Cre.WPRE.SV40 (Addgene 105540, a gift from James M. Wilson).
Surgery
Mice were deeply anaesthetized using 5% isoflurane (Fluriso, VetOne, Boise, ID) in oxygen-enriched air (OxyVet O2 Concentrator, Vetequip, Pleasanton, CA), followed by a subcutaneous injection of 2 mg/kg meloxicam (OstiLox, VetOne, Boise, ID), and then fixed into a stereotaxic frame (Model 900, Kopf Instruments, Tujunga, CA) equipped with a robotic stereotaxic targeting system (Neurostar, Germany). Anesthetized mice were maintained on 2–2.5% isoflurane, and a core body temperature was maintained at 36°C using a feedback-controlled DC temperature controller (ATC2000, World Precision Instruments, Sarasota, FL). Eye ointment (GenTeal, Alcon, Switzerland) was applied to prevent dryness. The head was shaved, and the skin was sterilized using Betadine iodine solution (Purdue Products, Stamford, CT). 2% lidocaine (0.1 ml, Lidocaine 2%, VetOne, Boise, ID) was injected subcutaneously at the site of incision and a midline incision was made with a scalpel to expose the skull.
Injections
For retrograde neuronal tracings, retrogradely transported beads (0.2 μl, 1:2 diluted with saline, Lumafluor Inc., Durham, NC) were stereotaxically injected. For viral vectors, approximately 0.4 μl per hemisphere was injected bilaterally using pulled glass pipettes (tip diameter 10–20 μm, PC-100 puller, Narishige, Japan), connected to a pressure ejector (PDES-Pressure Application System, npi electronic equipment, Germany).
The CeA coordinates used were: 1.2–1.3 mm posterior to bregma, ±2.8–2.9 mm lateral to the midline and 4.1–4.3 mm below the dura. The DP coordinates used were 1.8–1.9 mm anterior to bregma, ±0.4–0.5 mm lateral to the midline and 3.1–3.2 mm below the dura. The DMH coordinates used were 1.7 mm posterior to bregma, ±0.5 mm lateral to the midline and 5 mm below the dura. The dl/l and vl PAG coordinates used were −4.16 mm (−4.72 mm for vlPAG) posterior to bregma, −0.4 mm lateral to the midline and 2.4 mm (2.7 mm for vlPAG) below the dura.
Fibre implantation for optogenetics
Animals were bilaterally implanted with LC optic fibre stubs (fibre: 0.48 NA, 200–230 μm diameter, 6 mm length, Plexon) two-three weeks after viral vector injection. Optic fibre tips were lowered to 100–200 μm above the CeA. Implants were fixed to the skull with two miniature screws (00.90-100-M-SS-FH, US Micro Screw, Seattle, WA), cyanoacrylate glue gel (SuperGlue, Ontario, CA) and dental cement (Ortho-Jet powder and black liquid acrylate, Lang, Wheeling, IL). Experiments were conducted four weeks after viral infections, to ensure adequate opsin expression.
Lens implantation for Ca2+ Imaging
Gradient index (GRIN) lens implantation surgery was performed as described previously.50,51 Mice were head fixed on the stereotaxic apparatus and a craniotomy was drilled over the DP coordinates, using a 1.2 mm diameter round drill burr (Harvard Apparatus, Holliston, MA). Three additional holes were drilled to implant stainless steel screws (US Micro Screw, 00.90-100-M-SS-FH). The skull surface was cleaned from bone fragments and wiped using sterilized cotton tips. We aspirated the overlying tissue up to 1–1.5 mm above the site of implantation with a bent 27G needle (NE-4527, Component supply, Sparta, TN) with intermittent sterile saline washes. A GRIN lens (1 mm diameter, 9 mm length, 0.5 NA, 1 pitch, part # 1050–002177, Inscopix, Palo Alto, CA) was attached to the stereotaxic arm using a custom-built lens holder, and lowered for 3 mm over the course of 10 min. Kwik-Sil (World Precision Instruments, Sarasota, FL) was used to fill in the gap between the lens and the skull and left to dry for 5 min. An adhesive cement (C&B S399 Metabond Quick Adhesive Cement System Parkell, Edgewood, NY) mixed with liquid polymer (Catalyst + Quick Base) was applied around the lens over the skull and screws and allowed to dry. The lens holder was carefully detached from the lens. Layers of dental cement mixed with black acrylate (Ortho-Jet powder and black liquid acrylate) were applied around the lens to build the circular ridge of ~0.5 mm high below the top of the lens, and a thick layer of Kwik-cast (World Precision Instruments, Sarasota, FL) was applied over the lens. Animals were then individually housed and allowed to recover for 2–3 weeks.
Baseplating and verification of Ca2+ transients
Mice were checked weekly for GCaMP6f fluorescence and Ca2+ transient activity after lens implantation, as previously described.51 For baseplating, mice were anesthetized with 5% isoflurane, fitted into the stereotaxic frame, and then maintained at 1%. A head-mounted miniscope (V4, UCLA open-source, http://miniscope.org/) was fixed on a custom-built holder that was attached to the stereotaxic arm.52 The focusing mechanism of the miniscope was set at mid-range. The coaxial cable from the miniscope was attached to the data acquisition box (DAQ-V3.2, UCLA), which was connected to the computer through USB 3.0. The baseplate was attached to the bottom of the miniscope and the miniscope objective lens was aligned over the relay lens. The recording software (Miniscope controller, UCLA) was turned on and LED light intensity (25%), gain, and frame rate (30 fps) were set. To ensure maximum field of view and focus on the centre of the lens, the miniscope tilt was adjusted to view all edges of the relay lens. Then, the miniscope was slowly moved in X, Y, Z planes to locate active cells/transients. If there were no transients, the mouse was returned to the homecage and checked again the following week.
If Ca2+ transients were observed, they were further confirmed using tail pinch. If multiple cells were observed, then mice were baseplated. Dental cement mixed with black acrylate was applied layer-by-layer between the baseplate and the circular ridge built during lens implantation. The dental cement was applied so that no light could pass through from the outside. After the cement dried, the miniscope was detached and a plastic cover was installed to protect the relay lens.
Miniscope recordings
Animals with Ca2+ transients were subjected to the 4-day conditioned flight paradigm (described below). Data was continuously recorded at 30 frames/sec. Behaviour was simultaneously recorded to video (“Pike” camera, Allied vision, Germany). Only mice with flight responses were included in the Ca2+ data analysis.
Ca2+ imaging processing.
Ca2+ imaging videos were concatenated using ImageJ software (https://imagej.nih.gov/ij/download.html). The concatenated videos were then processed using MATLAB and an open source analysis package (https://bahanonu.github.io/ciatah/) as described previously.51,53 The videos were pre-processed by correcting for motion and temporally downsampled by a factor of six. After pre-processing the videos, we extracted individual neurons and their activity traces by using the open-source package Constrained Nonnegative Matrix Factorization for microEndoscopic data (CNMF-E; https://github.com/zhoupc/CNMF-E). The extracted cells were then manually identified based on the spatial filter and activity trace of each candidate cell along with the candidate cells’ average Ca2+ transient waveform. Data were averaged over a 200 ms sliding window. The data was normalized by calculating Z-scores (subtracting mean activity scores of entire recording from each activity trace, divided by the standard deviation of each cell during whole period) and the neurons with peaks that were ≥3 s.d. above baseline were considered as active neurons. To determine statistically significant changes in responses of the DP-to-CeA projecting cells to the tone and WN, the Z-scores from the corresponding periods were averaged and compared. After finishing the experiments animals were perfused and their brains were isolated to confirm lens placement. Only data from animals with correct lens placement was used for analysis.
Behavioural paradigms
Conditioned flight paradigm
Two different contexts were used. Context A (low-threat context) consisted of a clear cylindrical chamber with a smooth floor, while Context B (high-threat context) consisted of a square enclosure with an electrical grid floor used to deliver alternating current footshocks (ENV-414S, Med Associates Inc., Fairfax, VT). These two chambers were cleaned with 1 % acetic acid and 70 % ethanol, respectively. An overhead speaker (ENV-224AM, Med Associates Inc.) delivered auditory stimuli generated by a programmable audio generator (ANL-926, Med Associates, Inc.). Behavioural protocols were generated using MedPC software (Med Associates, Inc.)
We used a four-day conditioned flight paradigm, as described previously.2,21 In brief, during preconditioning in context A mice receive 4 presentations of a serial compound stimulus (SCS) consisting of a 10 s tone (7.5 kHz, 500 ms pips at 1 Hz, 75dB) and a 10 s white noise (WN, random distribution of 1 to 20,000 Hz, 500 ms pips at 1 Hz, 75dB). On Days 2 and 3 in Context B, mice are presented with five pairings of the SCS co-terminating with a 1 s, 0.9 mA footshock. During recall in Context A (or Context B for recall in high-threat context group), mice were presented with 4 trials of the SCS without footshock.
Quantification of defensive behaviour
All sessions were recorded to video, and behaviour was analysed using contour tracking (Cineplex software, Plexon, Dallas, TX). Freezing was defined as a complete cessation of movement for at least 1 s and was automatically scored using a frame-by-frame analysis of pixel changes (Cineplex Editor, Plexon). Results were confirmed by a trained observer blinded to condition. By determining a calibration coefficient using the chambers’ known size and the camera’s pixel dimensions, speed (cm/s) was extracted using the animal’s centre of gravity.21
Escape jumping was scored manually from video files by a blinded observer. Flight scores were calculated by dividing the average speed during each CS by the average speed during the 10 s pre-CS from all the trials (baseline, BL) and then adding 1 point for each escape jump (speedCS/speedBL + # of jumps). The flight score is therefore a combined score of forward bursts of speed (darting) and escape jumping behavior. A flight score of 1 indicates no change in flight behaviour from the preSCS period.
Open field test
A 45 × 45 × 45 cm arena made of white opaque Plexiglas was used. The arena was cleaned using 70% ethanol after each mouse. Mouse behaviour was tracked under 100 lux light conditions using a top-mounted camera (“Pike” camera, Allied vision, Germany). For chemogenetic experiments, the OFT duration was 10 min. For optogenetic experiments, the OFT duration was 6 min. After a 120 s baseline period, 4, 30 sec ON-OFF trials of light stimulation were used. For eNpHR experiments, a continuous orange light was used at 10 mW power at the fibre tip, and for ChR2 experiments, 10 ms pulses of blue light were used at 10 Hz, and 10 mW power at the fibre tip. The time spent in the inner zone, the number of entries into it, and total distance traveled were measured using tracking software (Cineplex Studio, Plexon).
Elevated plus maze
Behaviour was tracked using a top-mounted camera (“Pike” camera, Allied vision, Germany) for 10 min. The maze was made from white opaque Plexiglas material and consisted of four 30 cm long and 7 cm wide arms. Two open arms had no walls, and two enclosed arms had 15 cm high walls. The maze was elevated 40 cm above the ground. The arena was cleaned using 70% ethanol after every test. The total time spent in the open arms was calculated using Cineplex Editor software (Plexon).
Chemogenetic manipulations of behaviour
Behavioural testing was performed 3–4 weeks after viral injections. First, mice were subjected to the OFT. On the next day, animals were subjected to the EPM. Thirty min before the start of behavioural testing animals were injected with clozapine N-oxide [CNO; 0.5 mg/ml in vehicle (0.9% saline), given as 10 ml/kg for final dose of 5 mg/kg, intraperitoneally (ip); Enzo Life Sciences, Farmingdale, NY] or vehicle (10 ml/kg volume, ip).
Optogenetic manipulations of behaviour
For optogenetic modulation, we used a Plex controller system (Plexon) operated through Radiant software (Plexon). Two PlexBright LED modules (Plexon) were connected to the controller, and an LC patch cable (200–230 μm fibre, 1 meter long, 0.66 NA, Plexon) was connected. Laser power at the fibre tip was measured before every test with an optical power and energy meter (PM100D, ThorLabs, Newton, NJ). The patch cable was connected to the head-mounted fibre stubs using ceramic sleeves. Connectors were tested for coupling efficiency before implantations, and laser power at the fibre tip for behavioural manipulations was adjusted to reach a value of 10 mW.
Optogenetic inhibition experiments were performed using a within-subjects design with eight trials during FC2 (day 3), with 4 pairs of alternating trials of light ON/OFF (counter-balanced). During recall (day 4), mice were presented with 3 pairs of alternating light ON-OFF trials. On light trials, a 620 nm light was switched on 500 ms before the onset of the SCS (first tone pip) and remained on until the end of the last white noise pip (20.5 s in total). For ChR2-induced excitation of DP-to-CeA neuronal populations (Extended Data Fig. 5), we used 465 nm light pulses (20 Hz, 10 ms width) which began 500 ms before the onset of the SCS (first tone pip) and remained on until the end of the last white noise pip (20.5 s in total). For ChR2 manipulation during lower footshock intensity (0.68 mA) groups (Extended Data Figs 6–8), light pulses were delivered with the first WN pip and remained on until the end of 10 sec post cue periods (20.5 s in total). For optogenetic excitation/control experiments the mice were presented with 5 trials on Day 3 with 2 pairs of alternating light ON-OFF trials (counter-balanced). During recall mice were presented with 2 pairs of alternating light ON-OFF trials (counter-balanced). For recall in the high-threat context, we presented mice with 5 trials, all light ON.
Real-time place aversion test
We used a custom-made 50 × 50 × 50 cm arena made from white opaque Plexiglas and divided into two equal compartments. One side of the chamber was allotted as the stimulation side and other as a neutral side (non-stimulated, with striped walls and metallic plate floor). Mice were placed in the non-stimulated side, and 10 Hz blue LED light stimulation was delivered each time the mouse moved to the stimulation side of the chamber. The light stimulation was continuously on until the mouse moved back into the non-stimulation compartment. The session lasted 10 minutes and was recorded via a top mounted recording camera attached to recording system (Plexon) and scored using Cineplex editor (Plexon) by a blinded experimenter. The % time spent in the stimulation chamber was used as a measure of aversion.
Immunohistochemistry (IHC)
Following the completion of experiments, mice were anesthetized with tribromoethanol (240 mg/kg) and perfused transcardially with phosphate-buffered saline (PBS) followed by 4% paraformaldehyde in PBS. Brains were isolated and stored in paraformaldehyde overnight. On the next day, fixed brains were sectioned using a vibrating microtome (Precisionary, Greenville, NC) in 60- (for cFos IHC) or 80-μm thick coronal slices.
Antibody staining was performed on floating tissue sections. Briefly, sections were washed in PBS-TritonX100 (PBST, 0.3%) and blocked using 5% goat serum in PBST for 1 hr followed by an overnight (for RFP or GFP staining), or 48-h (for cFos staining), incubation in primary antibodies at 4°C. Primary antibodies used in this study were rabbit anti-RFP (1:1500, 600–401–379, Rockland Immunochemicals, Pottstown, PA), chicken anti-GFP (1:2000, NB100–1614, Novus Biologicals, USA), rabbit anti-cFos (1:1000, 226003, Synaptic Systems, Germany). After primary antibody incubation, sections were washed in PBST and incubated in secondary antibodies in PBST (1:500 donkey anti-rabbit AlexaFluor 555 (Cat #A31572) and goat anti-rabbit AlexaFluor 488 (Cat # A11034) or goat anti-chicken AlexaFluor 488 (Cat # A-11039), Thermo Fisher Scientific, USA). Following final rinses with PBS, sections were mounted and scanned from the DP and CeA.
Images were obtained using an Axio Scan.Z1 slide-scanning microscope (Zeiss, Germany) and a confocal microscope (FV3000, Olympus, Japan). Mice were included in subsequent data analyses only if bilateral expression specific to the target region was observed.
cFos quantification
Red fluorescent retro-beads were injected into the CeA of C57BL/6J mice. 7 days later, animals were divided into 4 groups: homecage control, shock-only, SCS-FC and unpaired. Shock-only, unpaired and SCS-FC mice were subjected to two days of conditioning and were sacrificed 90 min after the second session by transcardial perfusion. Following brain sectioning and IHC staining for cFos, confocal images were taken. The quantification of cFos+, bead+, and cells with both markers were performed by a blinded observer using ImageJ.
Brain slice electrophysiology
Slice preparation:
Coronal brain slices containing the CeA were collected from mice at least two weeks after viral injections for ex vivo electrophysiological recordings, as described earlier.35,54 Mice (9+ weeks) were anesthetized with tribromoethanol and transcardially perfused with ice-cold solution containing (in mM): 93 N-methyl-D-gluconate,, 2.5 KCl, 30 NaHCO3, 0.5 CaCl2, 10 MgSO4, 1.2 NaH2PO4, 20 HEPES, 25 glucose, 5 Na-ascorbate, 3 Na-pyruvate, 2 thiourea. Brains were dissected and 300 μmslices were prepared with a vibratome (Leica Microsystems, Germany) and maintained in oxygenated recording artificial cerebrospinal fluid (aCSF) containing (in mM): 126 NaCl, 2.5 KCl, 1.25 NaH2PO4, 1.3 MgCl2, 2.5 CaCl2, 26 NaHCO3, and 10 glucose. at 34°C for 30 min before decreasing the chamber temperature to ~20°C.
Patch clamp recording:
Slices were transferred to a submerged recording chamber mounted on the fixed stage of an Olympus BX51WI fluorescence microscope, visualized withdifferential interference contrast (DIC) illumination,and were continuously perfused with warmed (32°C) oxygenated aCSF at a rate of 2 ml/min. Whole-cell patch clamp recordings were performed in eYFP-labeled SOM+ or CRH+ neurons, retrolabeled neurons (1:10 diluted beads from dl/l or vl PAG), or unlabeled neurons in the CeM or CeL. Borosilicate glass pipettes with a resistance of 3–5 MΩ were filled with intracellular patch solution containing (in mM): 130 potassium gluconate, 10 HEPES, 10 phosphocreatine Na2, 4 Mg-ATP, 0.4 Na-GTP, 5 KCl, 0.6 EGTA; pH was adjusted to 7.25 with KOH and the solution had a final osmolarity of ~ 290 mOsm. Series resistance was below 15 MΩ immediately after break-in, and cells were discarded if it exceeded 30 MΩ. An optical fibre was placed approximately 2 mm above the slice and ChR2-expressing DP fibres were stimulated by 465 nm LED illumination (single 10-ms pulses,15 mW power, delivered at 1 Hz). EPSC sensitivity to DNQX (20 uM) was confirmed where indicated.
To assess firing properties in CeA neurons that displayed fast synaptic responses, 500–750 ms depolarizing current injections were applied in current clamp mode. To compare the properties of monosynaptic EPSCs evoked by optogenetic stimulation of DP fibers, responses were recorded in the presence of 1 mM 4-aminopyridine and 1 uM tetrodotoxin. Data were acquired using a Multiclamp 700B amplifier, a Digidata 1440A analog/digital interface, and pClamp 10 software (Molecular Devices, San Jose, CA). Recordings were filtered at 4 kHz and sampled at 20 kHz. Data were analyzed with Clampfit 10 (Molecular Devices, San Jose, CA). Statistical comparisons were conducted with a paired or unpaired Students’s t test (p < 0.05 with a two-tailed analysis was considered significant).
Statistics and Reproducibility
Data were analysed for statistical significance using Prism 10 (GraphPad Software, San Diego, CA). Statistical significance was set at p < 0.05. Data were tested for normal distribution using the Shapiro-Wilk normality test (α=0.05). For pairwise comparisons, the appropriate parametric (unpaired Student’s t-test) or nonparametric (Mann-Whitney test and Wilcoxon matched-pairs signed rank) test was performed. Data with more than two study groups were analysed using one-way ANOVA followed by Bonferroni’s post-hoc tests. For calcium imaging data analysis, we used custom code written in MATLAB. Correlations analysis and plotting regression lines were performed using the GraphPad Prism 10. The sample size was determined based on previously published research.
For the representative images presented in the figures the total number of replications is as follows: Fig. 1b–c, N = 6 mice; Fig. 1f,h, N = 5 mice; Fig. 1g,h, N = 6 mice; Fig.1l–m, N = 6 mice; Fig. 2c, N= 6 mice; Fig. 3b, N = 40 mice; Fig. 4c, N = 18 mice; Fig. 5e–f, N = 3 mice; Extended data figure 9b, N = 3 mice; Extended data figure 10, N = 3 mice.
Extended Data
Extended data Figure 1(Data related to Figure 1): Neuroanatomy of the DP-CeA pathway.
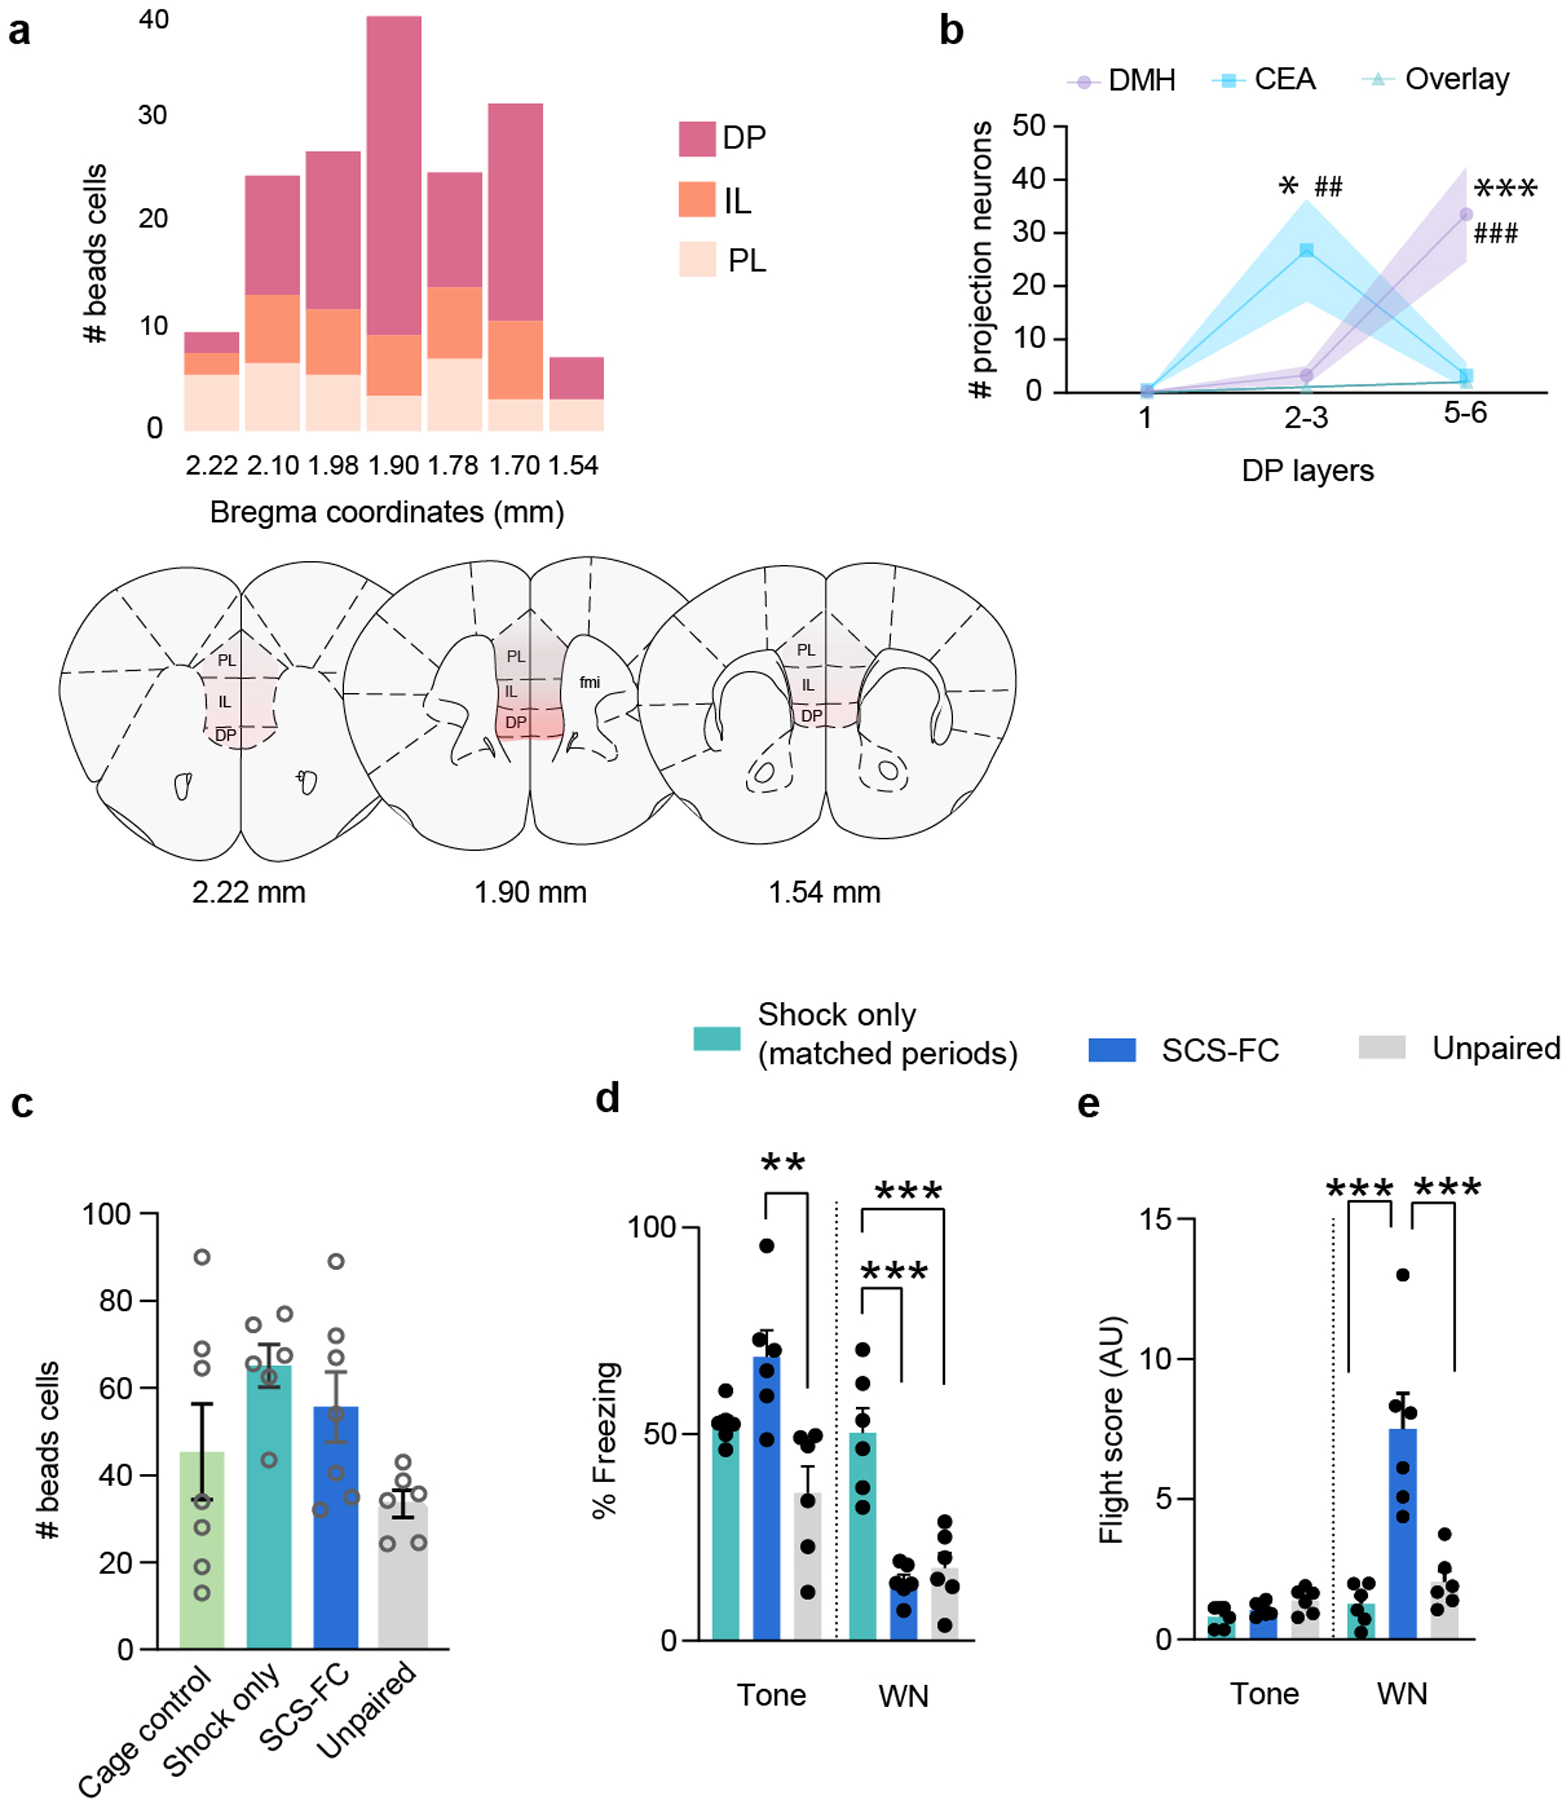
a, Top, Number of CeA-projecting mPFC cells across the antero-posterior axis. Bottom, Schematic of coronal sections showing the density of beads in DP on anterio-posterior scale. b, The layer-wise distribution of bead+ cells in the DP that project to CeA and/or DMH (N = 6 mice; two-way ANOVA, layer x group, F(4, 45) = 10.15, p < 0.0001; Bonferroni’s post-hoc test, *p<0.05, *** p <0.001 (DMH vs CeA), ##p <0.01, ###p <0.001 (vs overlay). c, Total number of bead+ cells across groups (N = 6 mice per group; 3–4 slices per group; one-way ANOVA, F(3, 22) = 2.819, p = 0.0626). d, Freezing of cFos groups on FC2 (N = 6 mice per group; one-way ANOVA for tone (F(2, 15) = 9.367, p = 0.0023) and white noise (WN; F(2, 15) = 22.68, p < 0.0001); Bonferroni’s post-hoc test). e, Flight scores of cFos groups on FC2 (N = 6 mice per group; one-way ANOVA for tone (F(2, 15) = 3.60, p = 0.052) and WN (F(2, 15) = 18.52, p < 0.0001); Bonferroni’s post-hoc test). Data in b-e represented as means ± s.e.m. Two-sided statistical tests were used. ***P < 0.001, **P < 0.01.
Extended data Figure 2 (Data related to Figure 2): Calcium imaging during pre-conditioning.
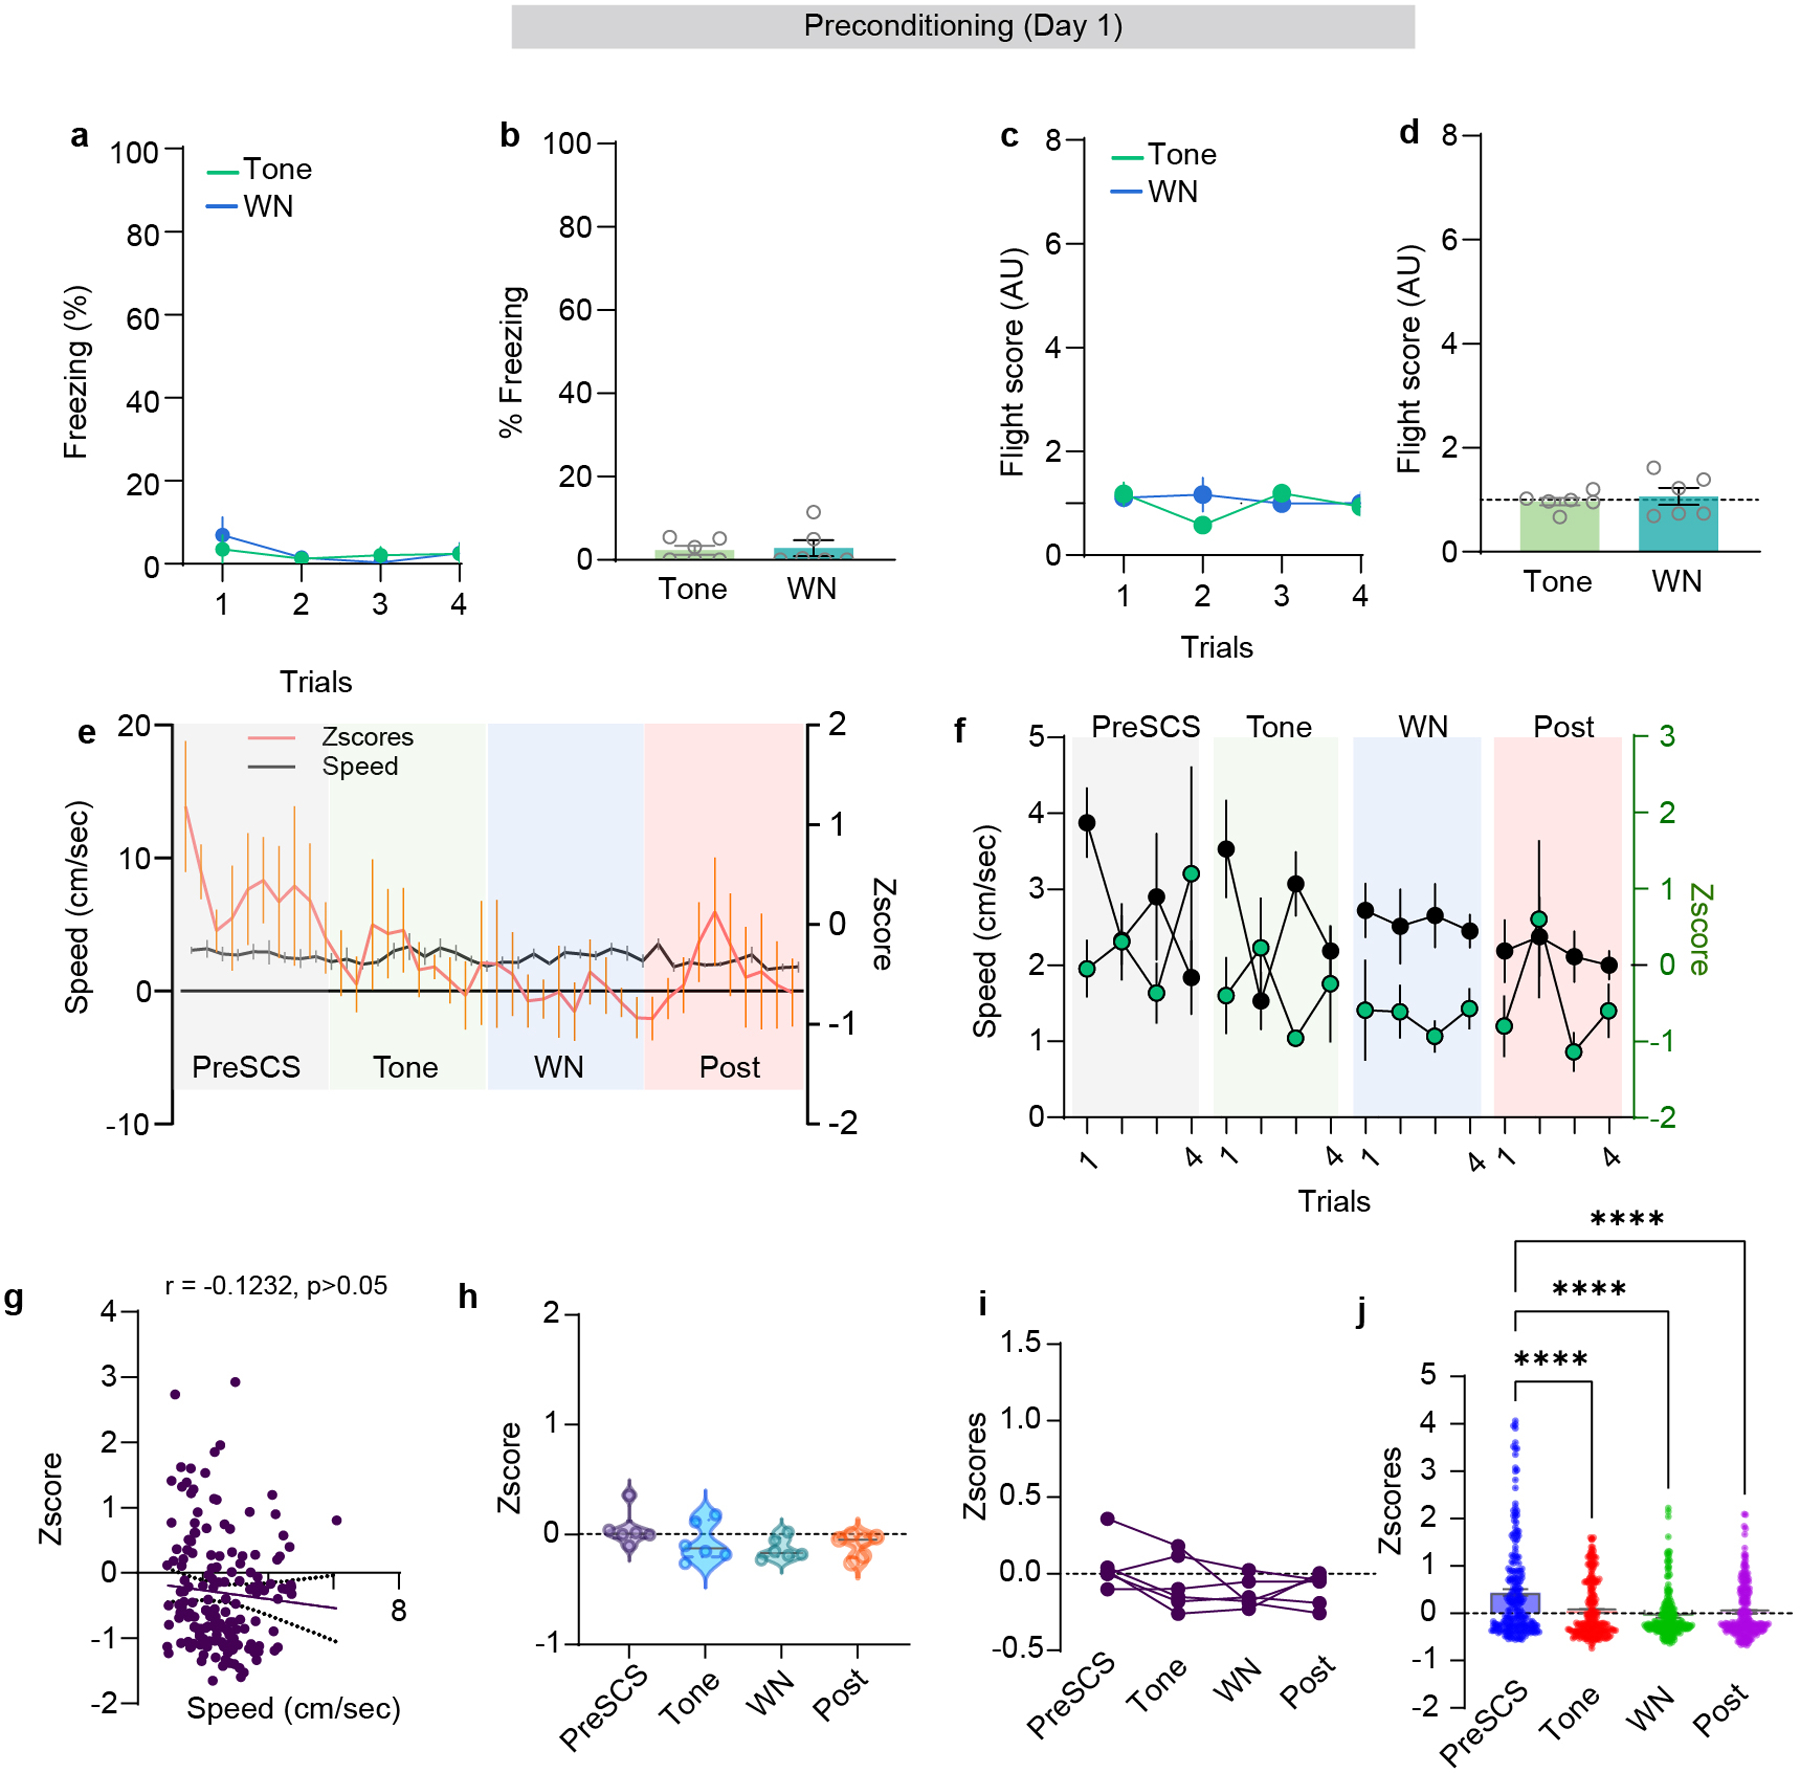
a-b, Trial-wise and average freezing of mice from calcium imaging experiments during preconditioning session (N = 6 mice; paired t-test, t=0.3051, df=5, p = 0.77). c-d, Trial-wise and average flight score of mice from calcium imaging experiments during preconditioning session (N = 6 mice; paired t-test, t=0.6565, df=5, p = 0.54). e, Speed and neuronal activity during the last trial of preconditioning session (n = 221 cells from 6 mice). f, Average speed and neuronal activity during each trial of preSCS, tone, WN and post-cue periods (n = 221 cells from 6 mice). g, Spearman correlation of speed and neuronal activity from all trials (10 sec each epoch of preSCS, tone, WN and post cue, each point represents one sec; n = 221 cells from 6 mice; r = −0.1232, 95% CI: −0.2774 to 0.03724, p = 0.12). h, Average Z-score of the DP-to-CeA population during the preSCS, tone, WN and post-cue periods (n = 221 cells from 6 mice; ordinary one-way ANOVA, F(3, 20) = 1.965, p = 0.15). i, Average Z-scores of individual mice during preSCS, tone, WN and post-cue periods (N = 6 mice). j, Z-scores of individual neurons during the last trial of preconditioning (n = 221 cells from 6 mice, one-way ANOVA, F(3, 880) = 21.43, P<0.0001; Bonferroni’s multiple comparisons test). Data in a-f and j represented as means ± s.e.m. Violin plots in h indicate median, interquartile range, and the distribution of individual data points. Two-sided statistical tests were used. ****p<0.0001
Extended data Figure 3 (Data related to Figure 2): Calcium imaging in the high-threat and low-threat contexts.
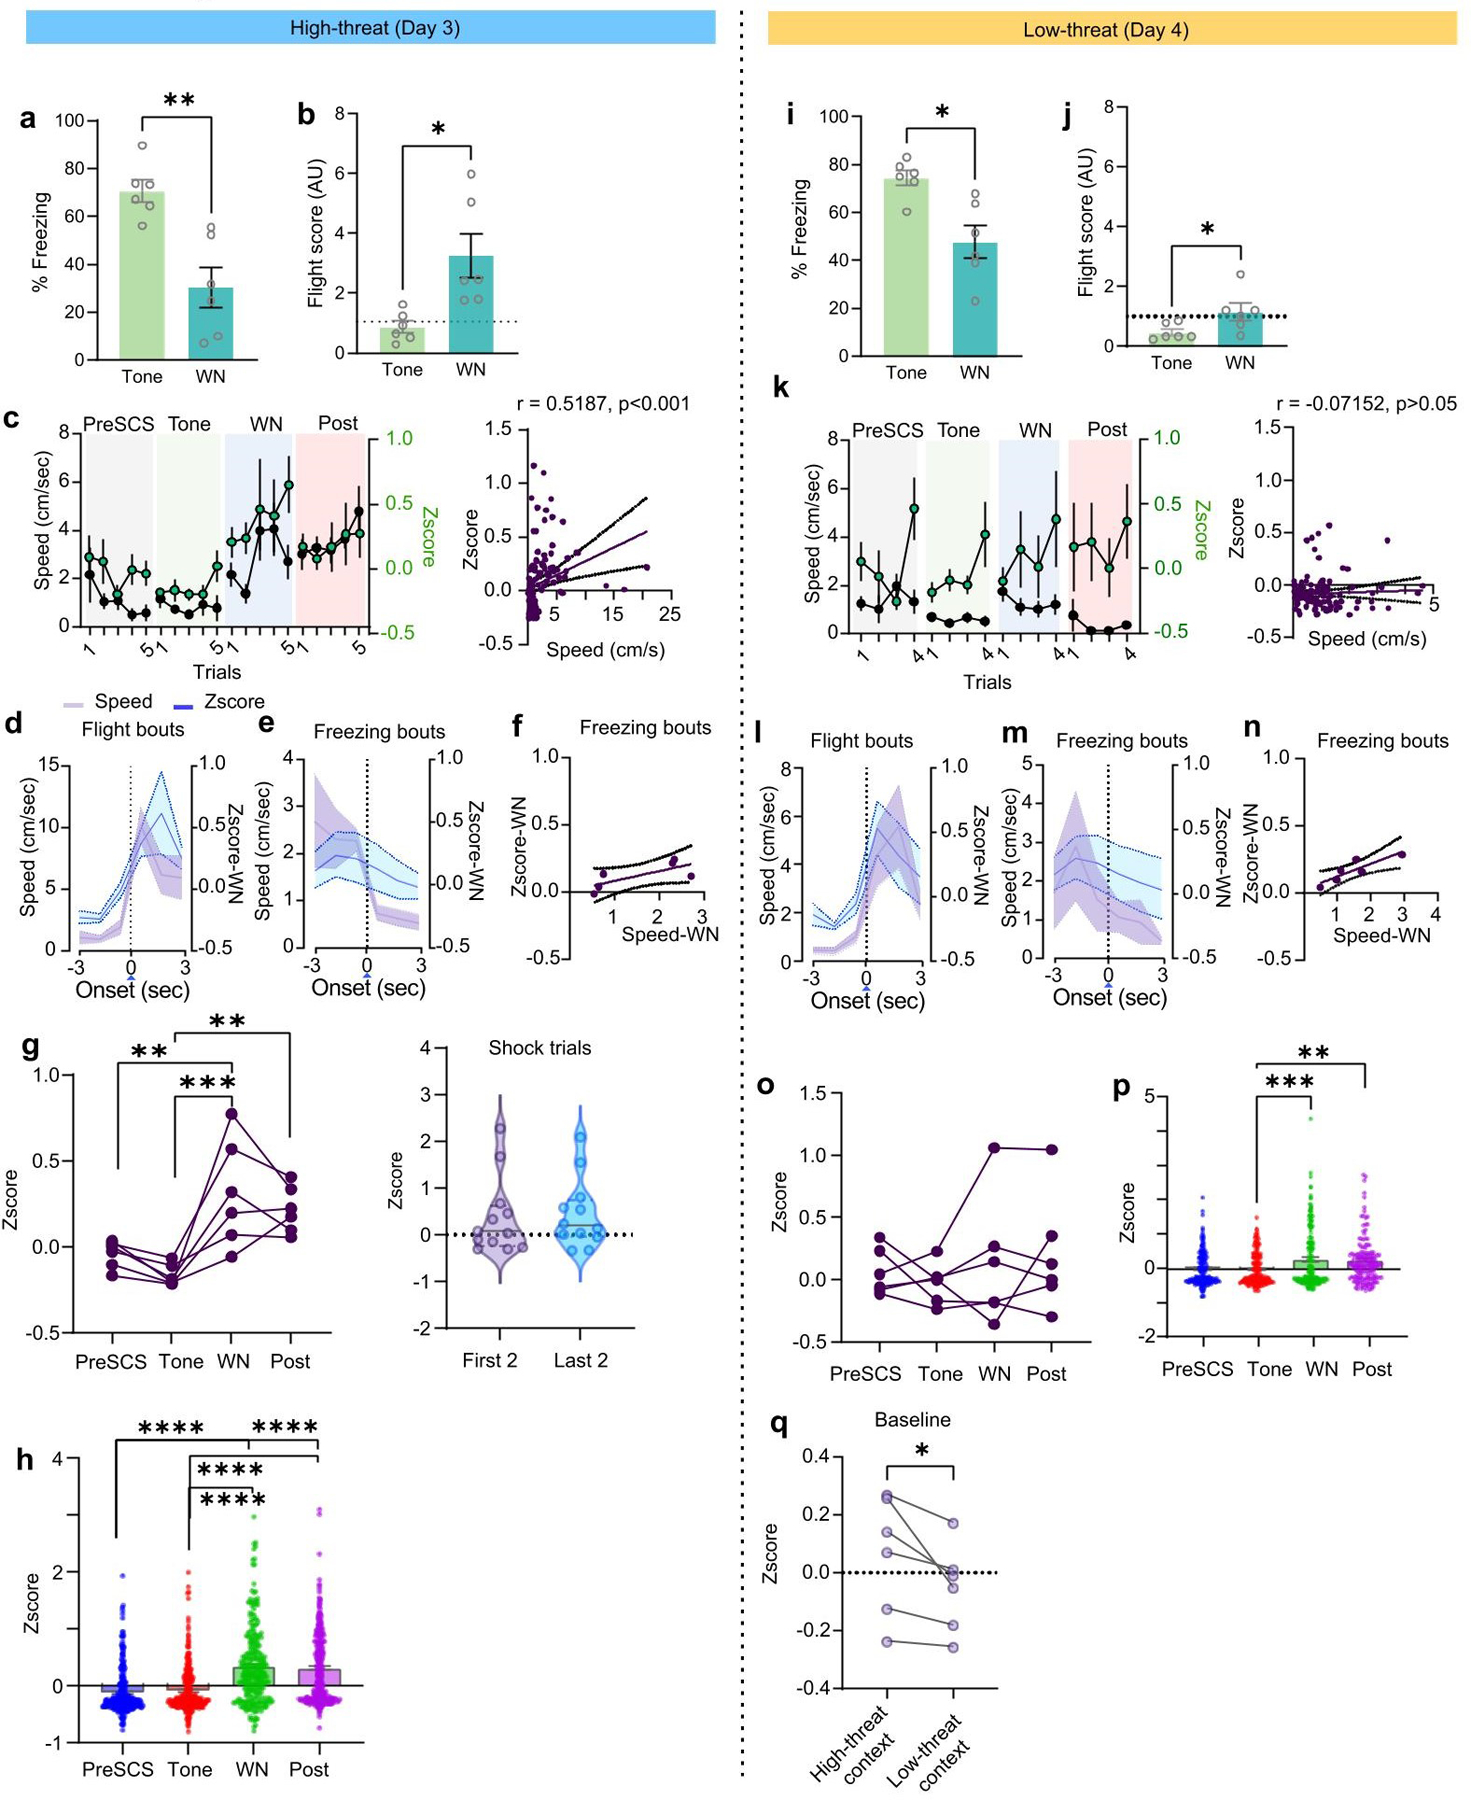
a, Freezing behaviour in the high-threat context (N = 6 mice; paired t-test, t=4.744, df=5). b, Flight scores in the high-threat context. (N = 6 mice; paired t-test, t=3.650, df=5). c, left, Average speed and neuronal activity during each trial of the preSCS, tone, WN and post-cue periods in the high-threat context (n = 273 cells from 6 mice). right, Spearman correlation of speed and neuronal activity from the last 3 trials (preSCS, tone, WN and post-cue epochs, each point represents data from 1 sec; n = 273 cells from 6 mice; r = 0.5187, 95% CI: 0.3696 to 0.6417, p<0.0001). d, Speed and neuronal activity aligned to the onset of flight bouts during WN in the high-threat context (n = 273 cells from 6 mice). e, Speed and neuronal activity aligned to the onset of freezing bouts during WN in the high-threat context (n = 273 cells from 6 mice). f, Spearman correlation plot for speed and Z-score from the identified freezing bouts (each dot represents values at each sec of the bouts, r = 0.657, 95% CI = −0.02019 to 0.1662, p = 0.175). g, left Z-scores of individual mice during preSCS, tone, WN and post-cue periods, across all trials (N = 6 mice; one-way ANOVA, F(3, 20) = 9.331, P=0.0005; Bonferroni’s multiple comparisons test). right, Z-scores of individual mice during first versus last 2 footshock periods (paired t-test, t=0.2289, df=11, each dot represents an individual mouse during a single trial). h, The Z-scores of individual neurons during preSCS, tone, WN and post-cue periods, from the last trial in the high-threat context (n = 273 cells from 6 mice, one-way ANOVA, F(3, 1112) = 59.01, P<0.0001; Bonferroni’s multiple comparisons test). i, Freezing in the low-threat context (N = 6 mice; paired t-test, t=3.424, df=5). j, Flight scores in the low-threat context. (N = 6 mice; paired t-test, t=2.889, df=5). k, left, Change in average speed and neuronal activity during preSCS, tone, WN and post-cue periods in the low-threat context over 4 trials (n = 273 cells from 6 mice). right, Spearman correlation of speed and neuronal activity from all recall trials in the low-threat context (preSCS, tone, WN and post cue epochs, each point represents 1 sec of data; n = 273 cells from 6 mice; r = −0.07152, 95% CI: −0.2526 to 0.1144, p = 0.43). l, Speed and neuronal activity aligned to the onset of flight bouts during WN in the low-threat context (n = 273 cells from 6 mice). m, Speed and neuronal activity aligned to the onset of freezing bouts during WN in the low-threat context (n = 273 cells from 6 mice). n, Spearman correlation of speed and neuronal activity from freezing bouts (n = 273 cells from 6 mice; each point represents one sec of data, r = 0.82, 95% CI = 0.02337 to 0.1669, P = 0.058). o, Population activity from individual mice during preSCS, tone, WN and post-cue periods, across all trials (N = 6 mice; one-way ANOVA, F(3,20) = 0.3923, P = 0.75). p, Neuronal activity of individual neurons during preSCS, tone, WN and post-cue periods, from the last trial in the low-threat context (n = 273 cells from 6 mice; one-way ANOVA, F(3,1008) = 5.566, P = 0.0009; Bonferroni’s multiple comparisons test). q, Z-scores of individual mice during context exposure (first 3 min baseline period) in high threat versus low-threat context (N = 6 mice; paired t-test, t=2.705, df=5). Data in a-c, d-e, h-k, l-m, and p represented as means ± s.e.m. Violin plots in g indicate median, interquartile range, and the distribution of individual data points. Two-sided statistical tests were used. ****P<0.0001, ***P < 0.001, **P < 0.01, *P < 0.05.
Extended data Figure 4 (Data related figure 4): Optogenetic inhibition of the DP-CEA pathway.
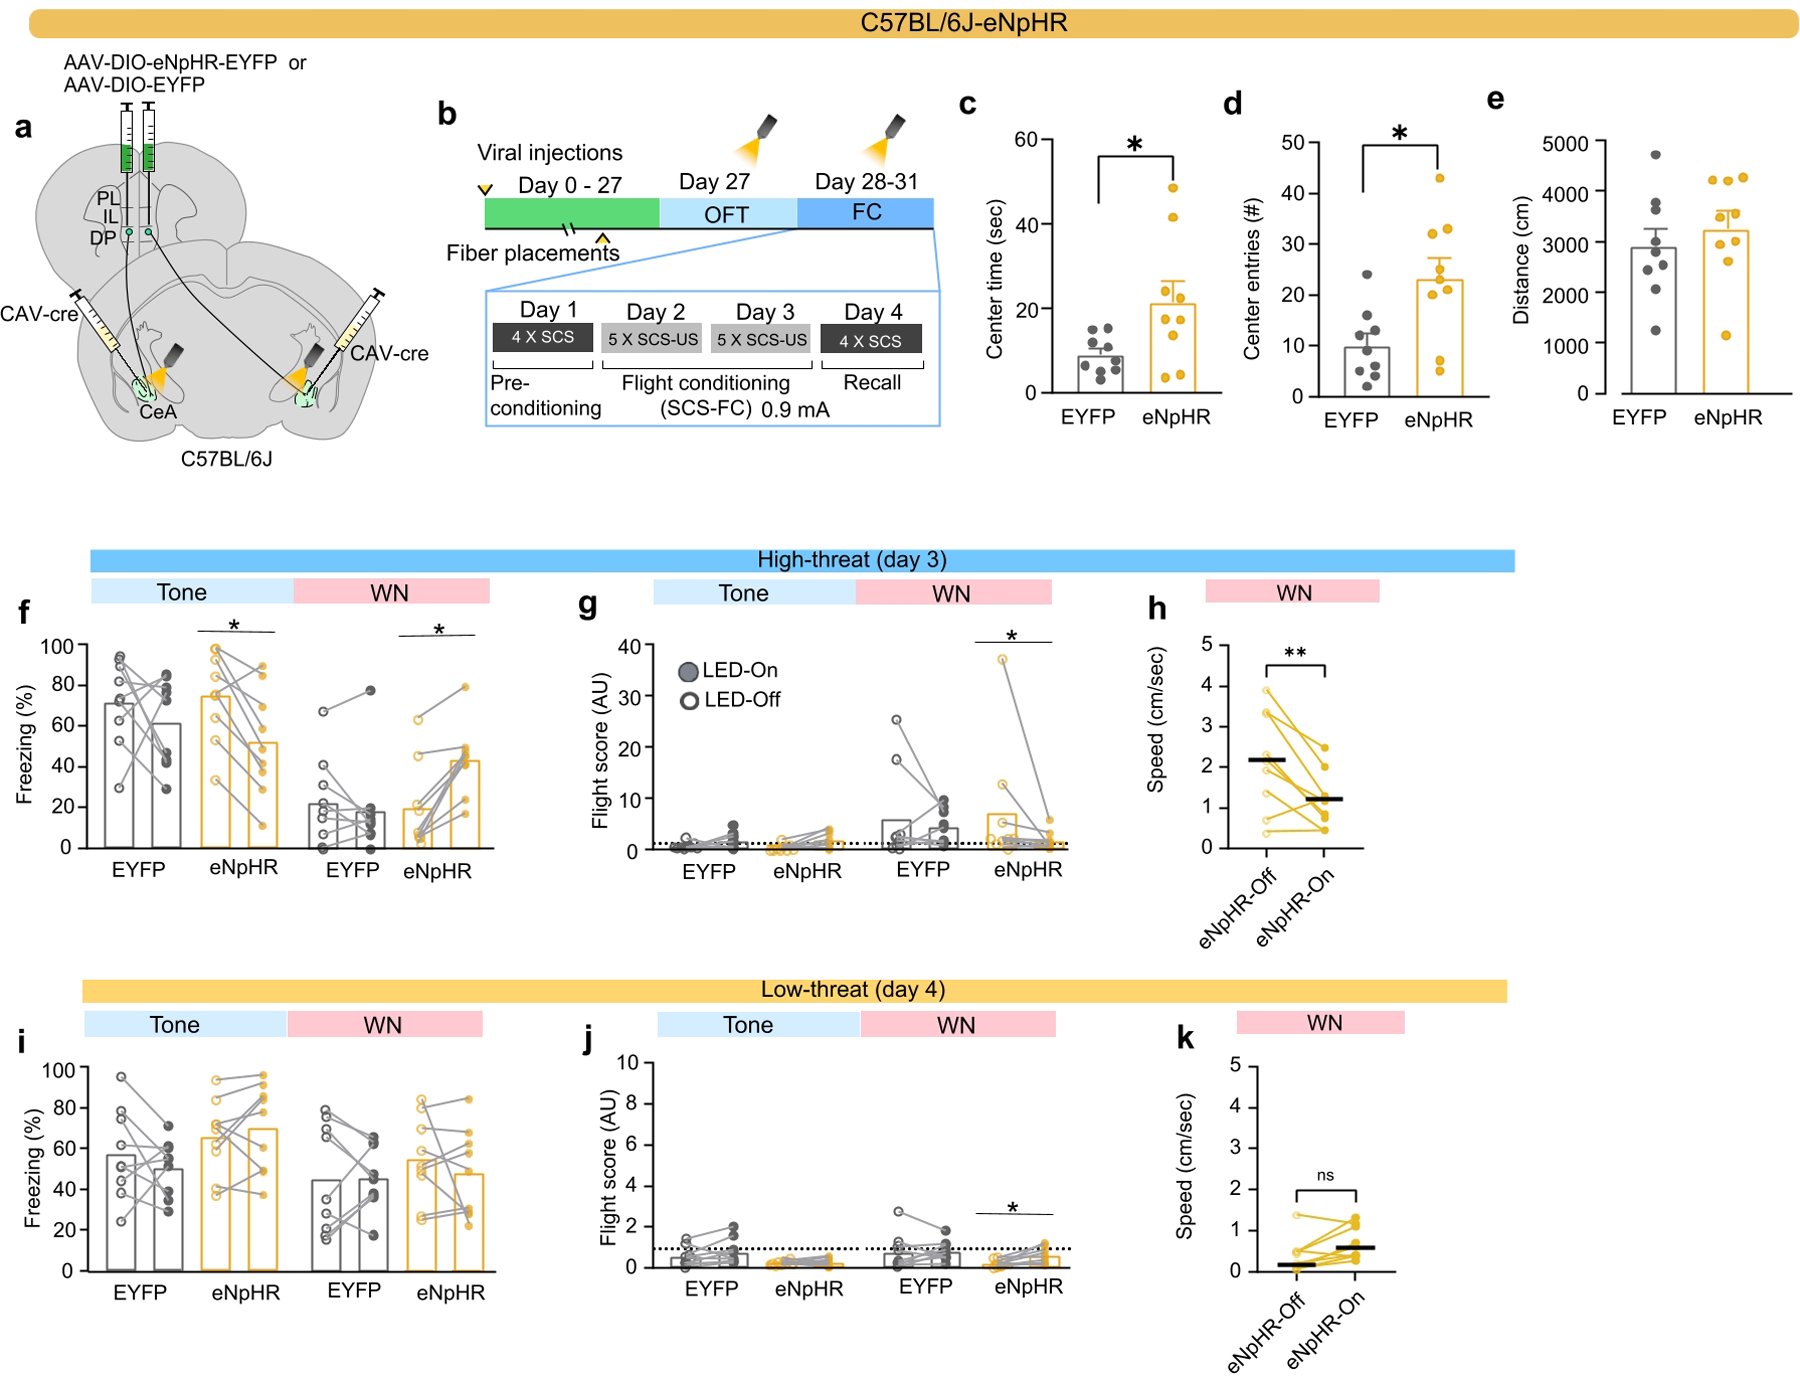
a, Intersectional approach used for optogenetic terminal inhibition of the DP-to-CeA neuronal projections. b, Experimental timeline. c-e, Effect of optogenetic inhibition on centre time (c), centre entries (d), and distance travelled (e) in the OFT (EYFP N = 9 mice, eNpHR N = 9 mice; unpaired t-test, t=2.357, df=16; t=2.813, df=16; and t=0.7250, df=16, respectively). f-h, Effect of optogenetic inhibition on EYFP (N = 9) and eNpHR (N = 9) mice in the high-threat context on f, freezing (LED-on vs LED-off, Mann-Whitney), g, flight (LED-on vs LED-off, Mann-Whitney), and h, speed during WN (Paired t-test t=3.497, df=8, p = 0.0081). i-k, Effect of optogenetic inhibition in EYFP (N = 9) and eNpHR (N = 9) groups in the low-threat context on i, freezing (LED-on vs LED-off, Mann-Whitney, n.s.), j, flight (LED-on vs LED-off, Mann-Whitney) and k, speed during WN in the eNpHR group (Paired t-test, t=2.619, df=8, p = 0.307). Data in c-e represented as mean ± s.e.m. Data in f-k represented as mean with individual data points. Two-sided statistical tests were used. **P < 0.01, *P < 0.05.
Extended data Figure 5 (Data related figure 4): Non-cell type specific stimulation of the DP-CEA pathway.
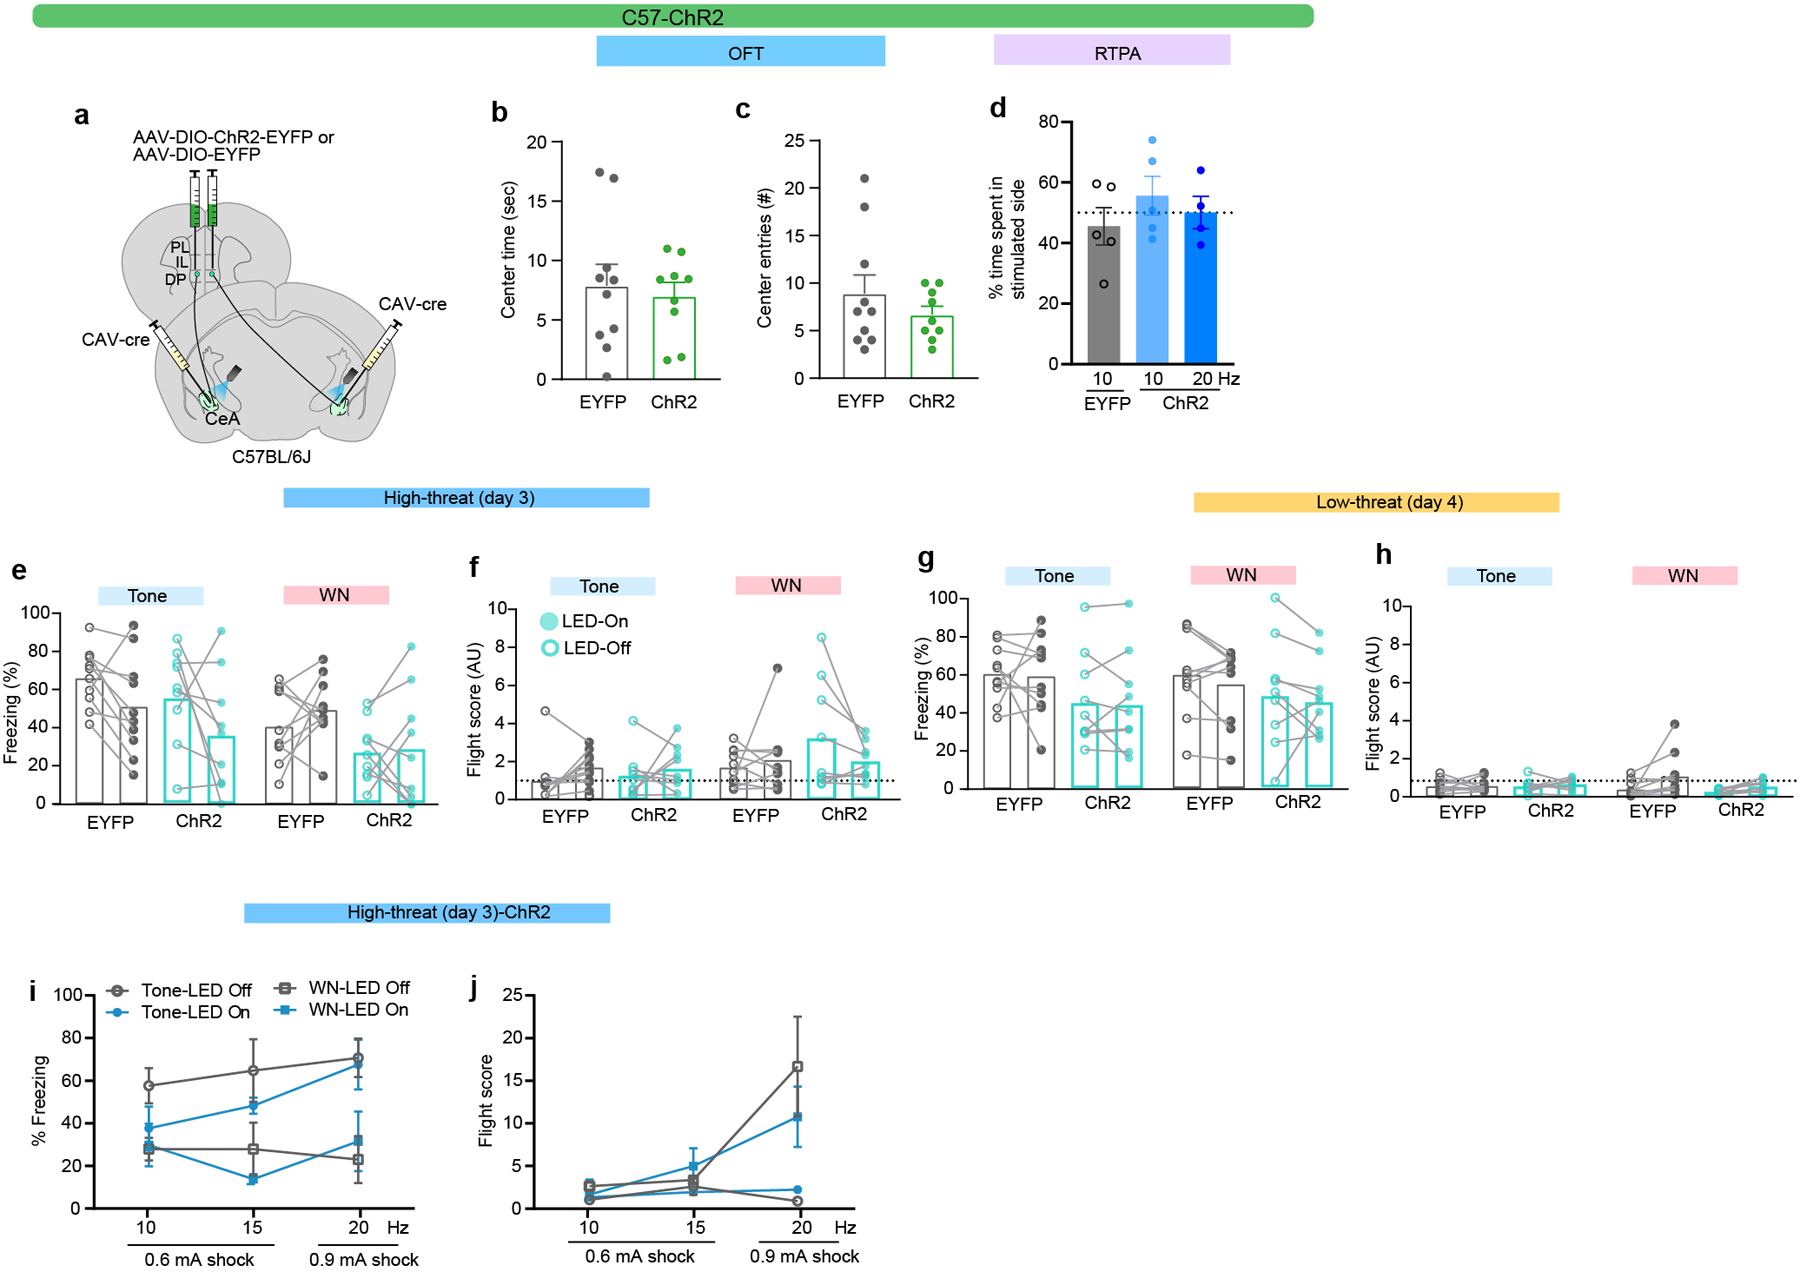
a, Intersectional approach used to target optogenetic stimulation to DP-to-CeA terminals. b-c, Effect of optogenetic stimulation on OFT centre time (b) and centre entries (c) in EYFP (N = 10) and ChR2 (N = 9) groups (Unpaired t-test, n.s., t=0.3950, df=17, and t=1.001, df=17, respectively). d, Effects of optogenetic stimulation on real-time place avoidance in EYFP (10 Hz, N = 5) and ChR2 (10 Hz, N = 5; 20 Hz, N = 4) groups (One-way ANOVA F(2, 11) = 0.73, p = 0.502). e-f, Effect of optogenetic excitation in EYFP (N = 10) and ChR2 (N = 9) groups in the high-threat context on e, freezing (LED-on vs LED-off, Mann-Whitney, n.s.) and f, flight (LED-on vs LED-off, Mann-Whitney, n.s.). g-h, Effect of optogenetic excitation in EYFP (N = 10) and ChR2 (N = 9) groups in the low-threat context on g, freezing (LED-on vs LED-off, Mann-Whitney, n.s.) and h, flight (LED-on vs LED-off, Mann-Whitney, n.s.). i-j, Freezing (i) and flight scores (j) during optogenetic stimulation during day 3 at different stimulation frequencies and shock intensities (at 0.6 mA – 10 Hz, N = 9; 15 Hz, N = 3; at 0.9 mA – 20 Hz, N = 5; two-way ANOVA (for % freezing, Stimulation frequency x Shock intensity, F(6, 56) = 0.76, p = 0.601, Stimulation frequency, F(2, 56) = 1.10, p = 0.339, Shock intensity, F(3, 56) = 8.37, p = 0.0001; for flight, Stimulation frequency x Shock intensity, F(6, 56) = 4.42, p = 0.001, Shock intensity, F(3, 56) = 6.66, p = 0.001; Bonferroni’s post hoc test (tone/WN ON vs OFF non-significant). Data represented as mean (± s.e.m. in b-d and with individual data points in i-j). Two-sided statistical tests were used.
Extended data Figure 6 (Data related figure 4): Stimulation of the DP-CEA pathway using a CaMKII promotor.
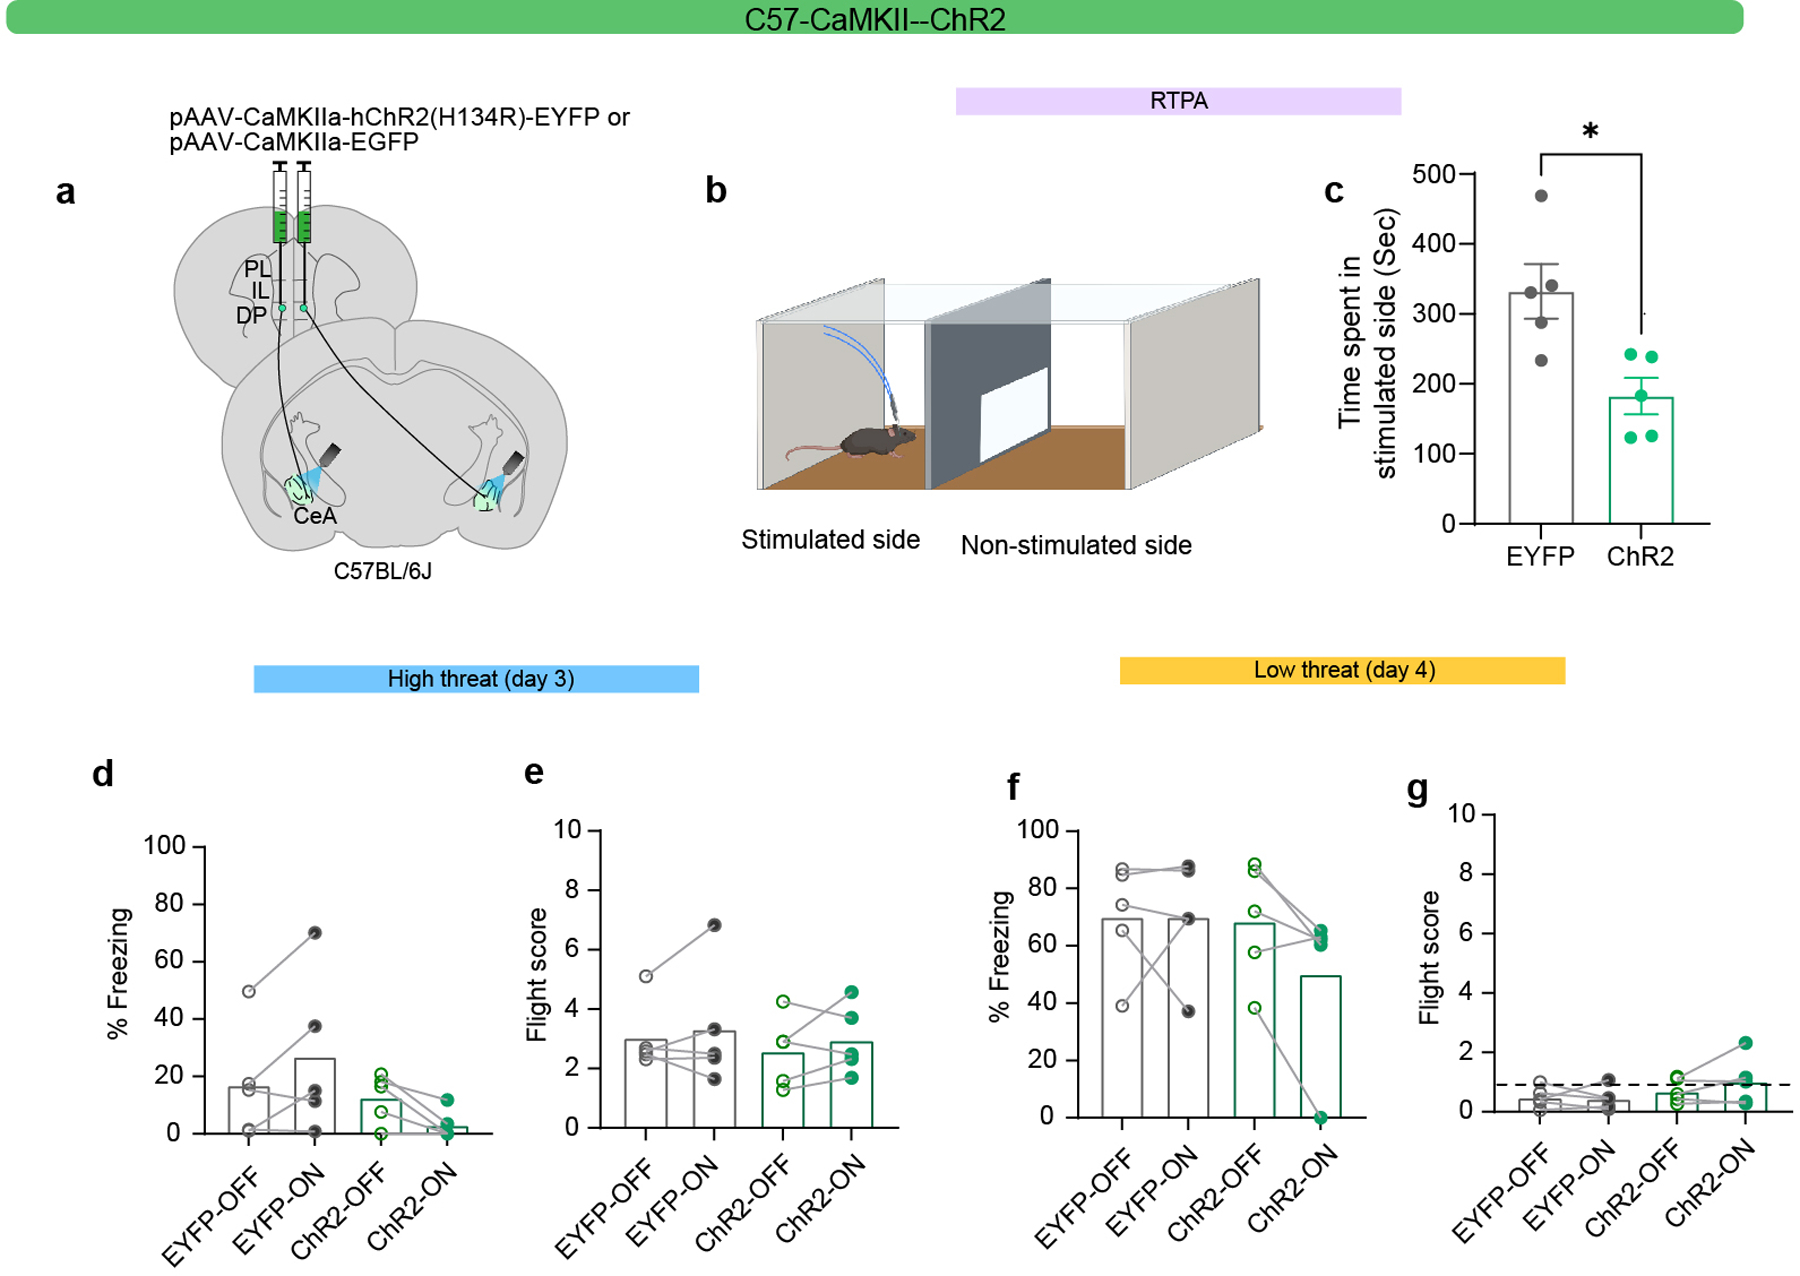
a, Viral injection strategy for optogenetic terminal stimulation of DP-to-CeA neuronal projections. b-c, Schematic (b) and results (c) of real-time place aversion (RTPA) in EYFP (20 Hz, N = 5) and ChR2 (20 Hz, N = 5) groups (Unpaired t-test, t=3.191, df=8). d-e, Effect of optogenetic excitation in EYFP (N = 5) and ChR2 (N = 5) groups in the high-threat context on d, freezing (LED-on vs LED-off, paired t-test, n.s.) and e, flight scores (LED-on vs LED-off, paired t-test, n.s.). f-g, Effect of optogenetic excitation in EYFP (N = 5) and ChR2 (N = 5) groups in the low-threat context on f, freezing (LED-on vs LED-off, paired t-test, n.s.) and g, flight scores (LED-on vs LED-off, paired t-test, n.s.). Data represented as mean ± s.e.m. in c and with individual data points in d-g. Two-sided statistical tests were used. *P < 0.05
Extended data Figure 7 (Data related figure 4): Optogenetic stimulation of the Vglut1+ DP-CEA pathway.
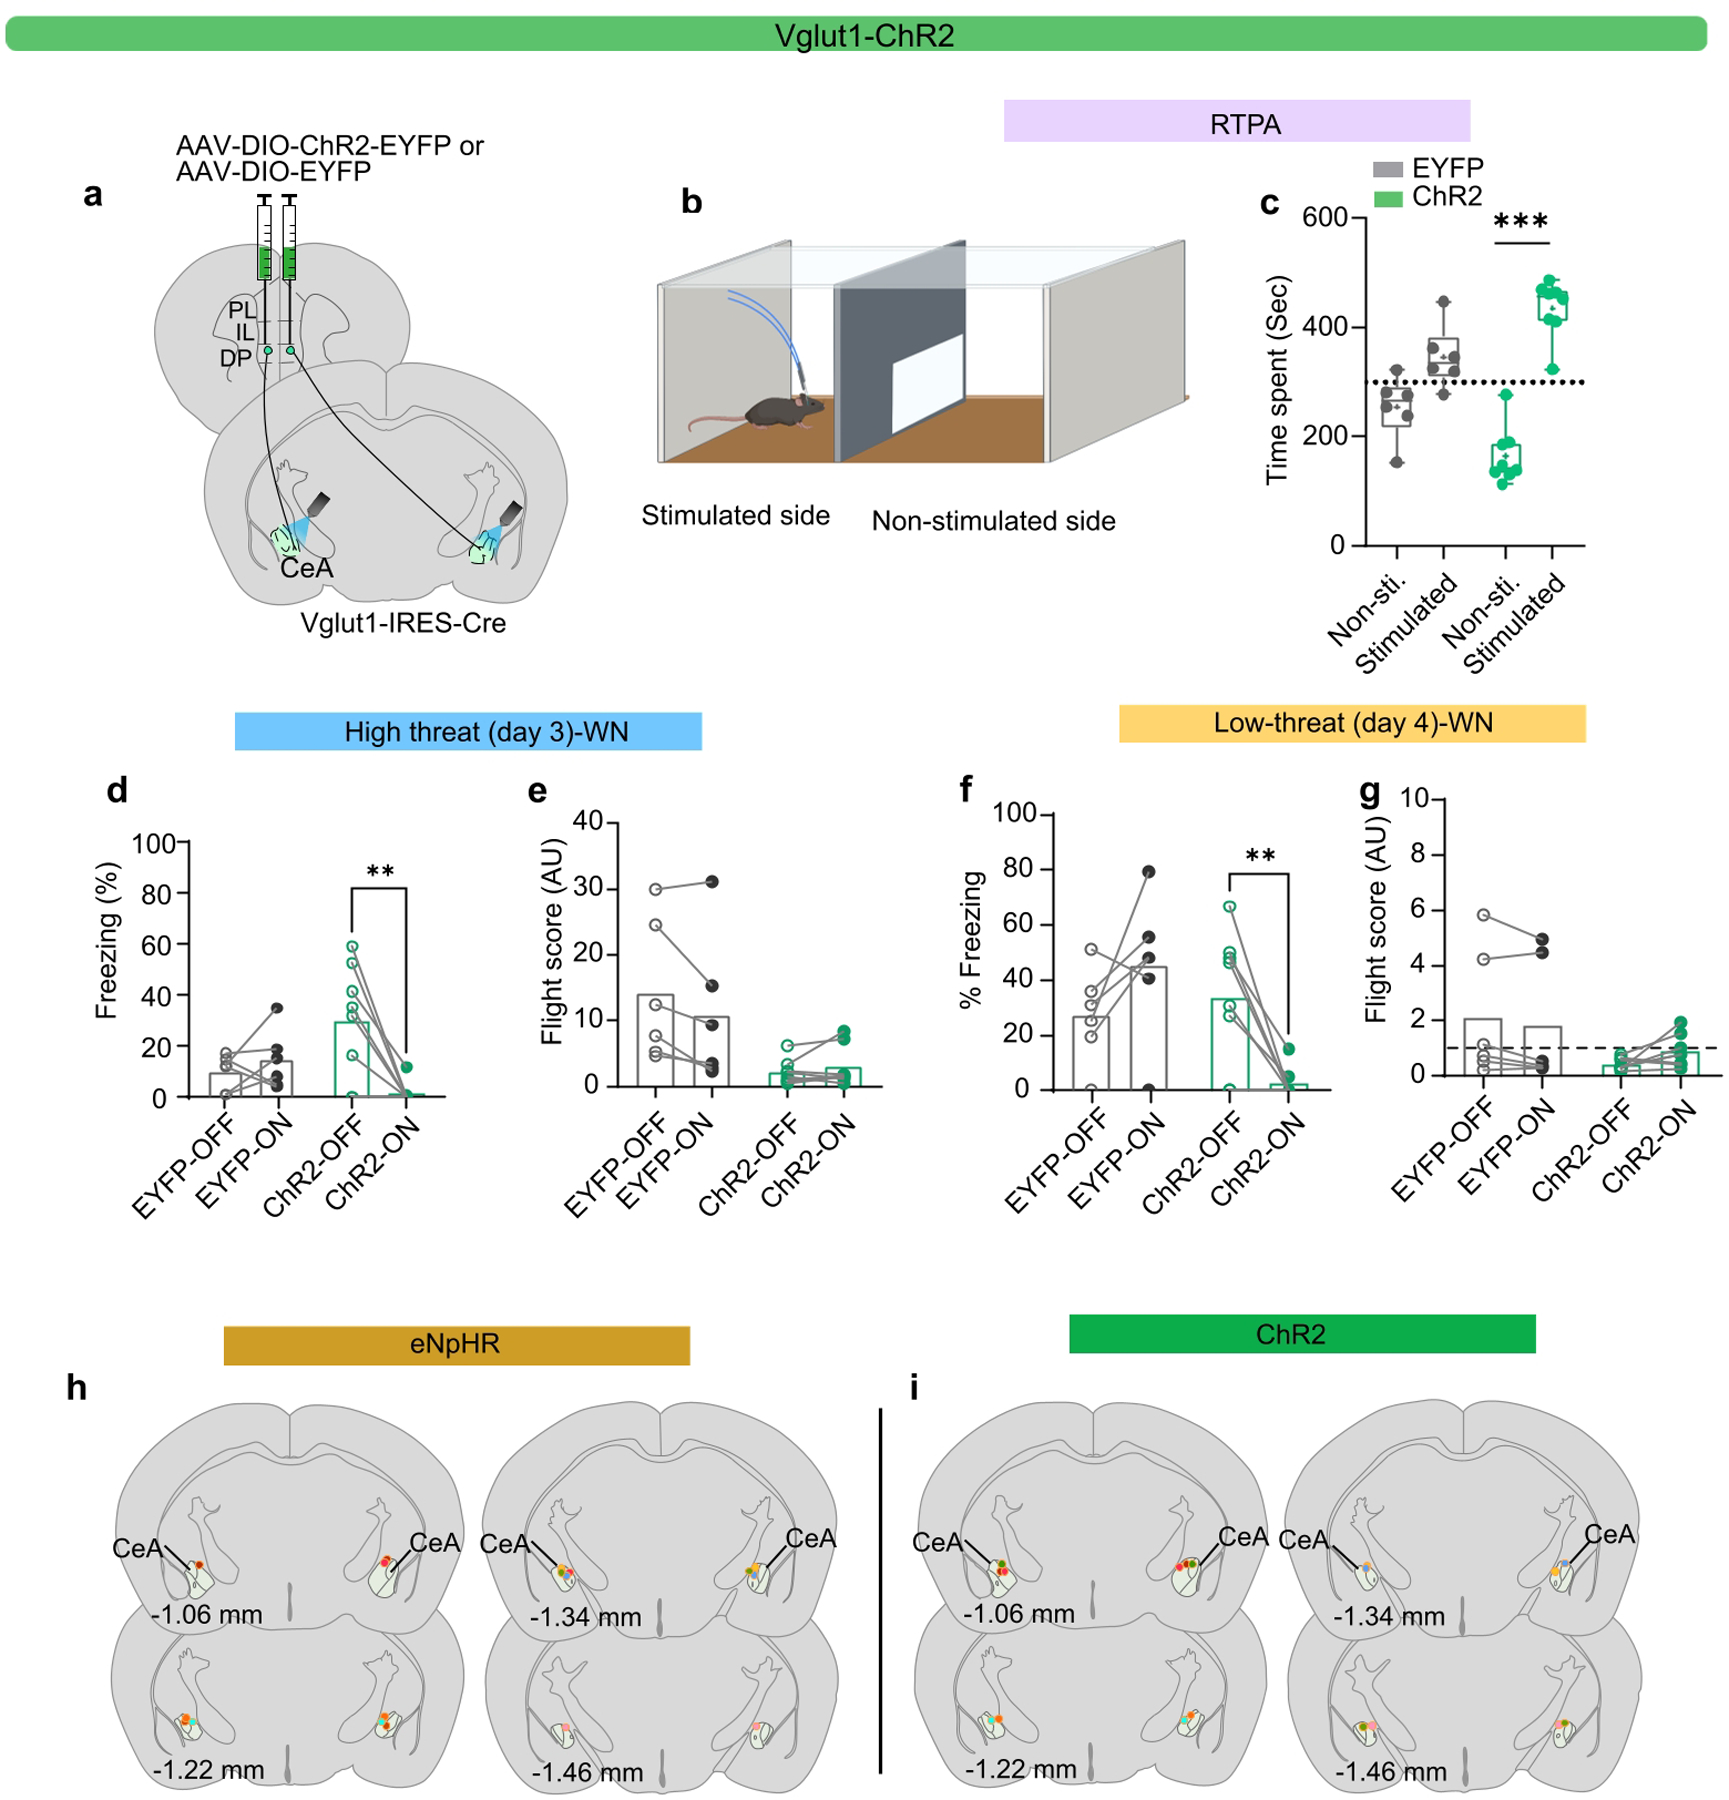
a, Viral injection strategy for optogenetic terminal stimulation of DP-to-CeA neuronal projections. b-c, Schematic (b) and real-time place aversion (RTPA) performance (c) from EYFP (N=6) and ChR2 (N=8) groups (unpaired t-test, EYFP (t=1.974, df=5, P =0.10), ChR2 (t=7.339, df=7). d-e, Effect of optogenetic excitation in EYFP (N = 6) and ChR2 (N = 8) groups in the high-threat context on d, freezing during WN (LED-on vs LED-off, paired t-test, ChR2, t=3.650, df=7) and e, flight during WN (LED-on vs LED-off, paired t-test, ChR2, t=1.077, df=7, P =0.31). f-g, Effect of optogenetic excitation in EYFP (N = 6) and ChR2 (N = 8) groups in the low-threat context on f, freezing during WN (LED-on vs LED-off, paired t-test, ChR2, t=3.748, df=7) and g, flight score during WN (LED-on vs LED-off, paired t-test, ChR2, t=2.211, df=7, P =0.06). h, Example fibre placements over the CeA for the eNpHR groups (N = 9). I, Example fibre placements over the CeA for the ChR2 groups (N = 9). Box and whisker plots in c indicate median, interquartile range, and min. to max. of the distribution, crosses indicate means. Data in d-g represented as mean with individual data points. Two-sided statistical tests were used. ***P < 0.001, **P < 0.01.
Extended data Figure 8 (Data related figure 4): Optogenetic stimulation of the Vglut2+ DP-CEA pathway.
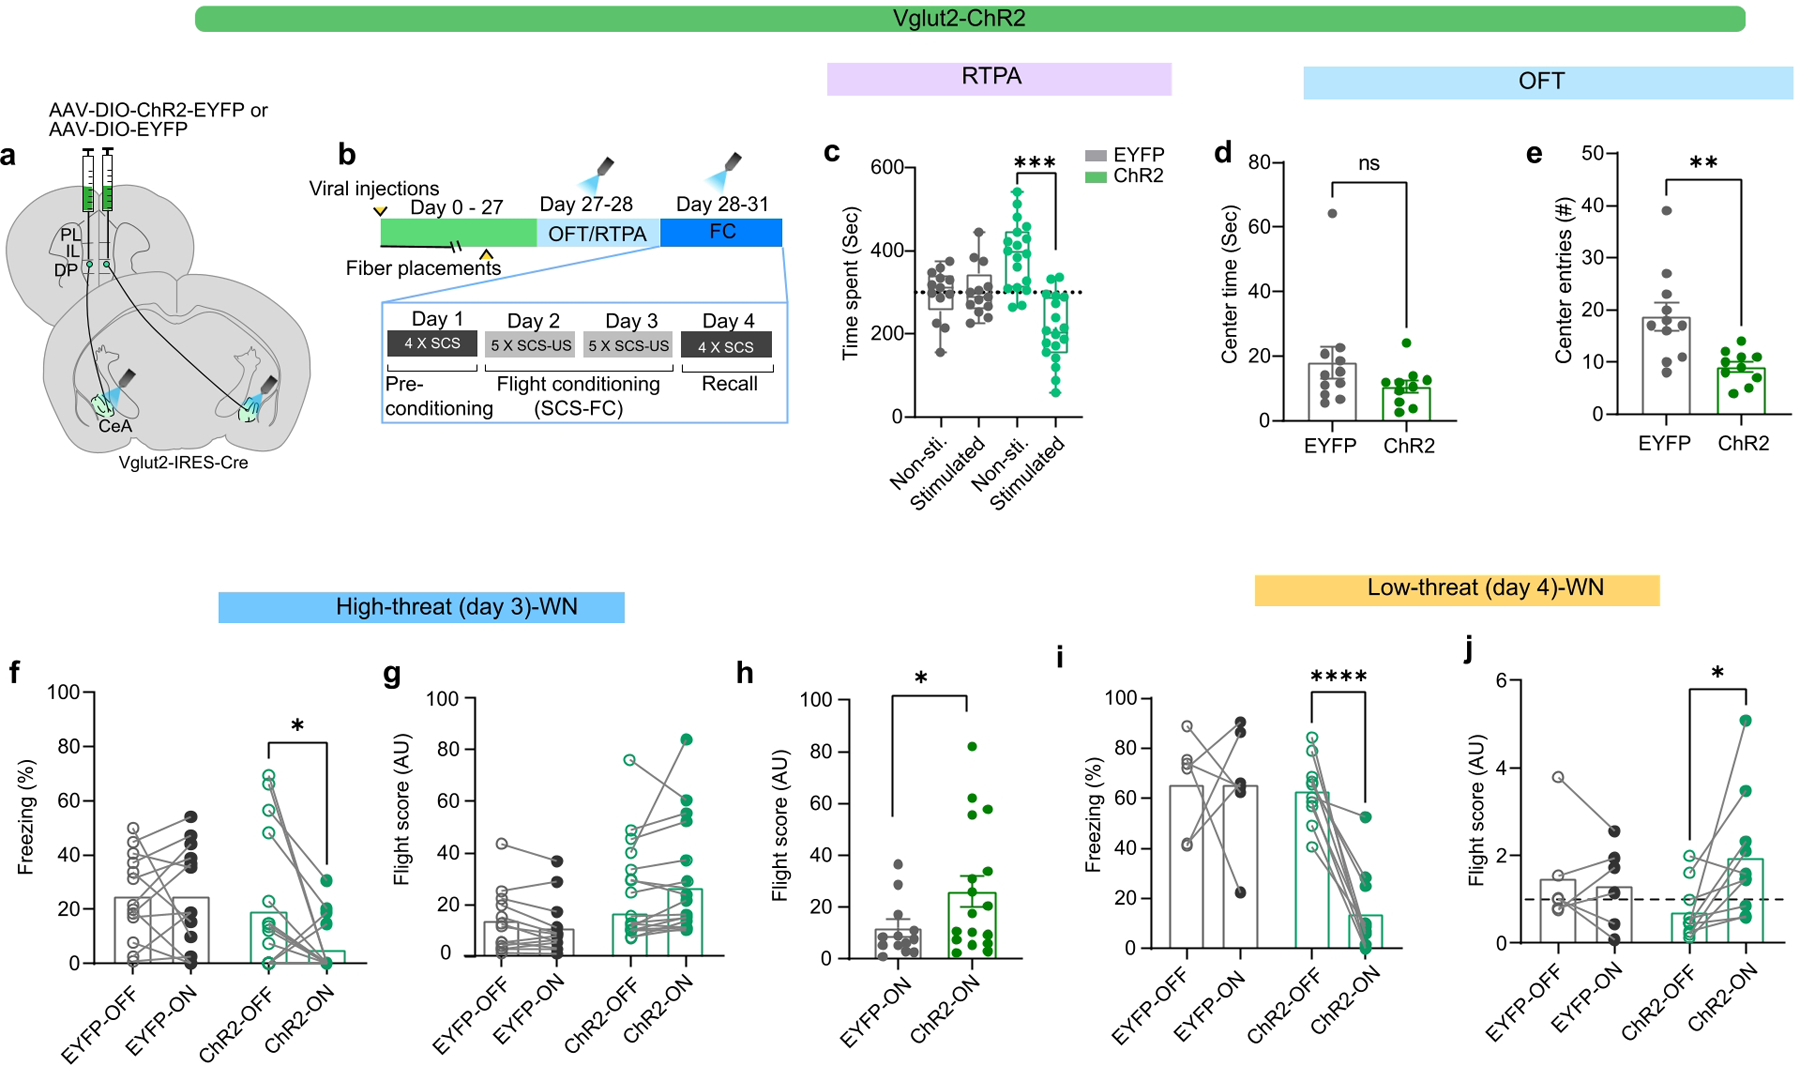
a, Viral injection strategy for optogenetic terminal stimulation of DP-to-CeA neuronal projections). b, Experimental timeline. c, Real-time place aversion (RTPA) performance of EYFP (N=13) and ChR2 (N=17) groups (paired t-test, EYFP (t=0.2167, df=12, P =0.83), ChR2 (t=4.713, df=17). d-e, Effect of optogenetic excitation on OFT centre time (d) and number of entries into the centre zoneI) in EYFP (N=11) and ChR2 (N=10) groups (unpaired t-test, t=3.288, df=19). f-g, Effect of optogenetic excitation in EYFP (N = 13) and ChR2 (N = 17) groups in the high-threat context on f, freezing during WN (LED-on vs LED-off, Wilcoxon matched-pairs signed rank test, ChR2) and g, flight during WN (LED-on vs LED-off, Wilcoxon -test, ChR2, P = 0.07). h, Comparison of flight scores in the LED-on condition between EYFP control and ChR2 groups (Mann Whitney test, P = 0. 0.0349). i-j, Effect of optogenetic excitation in EYFP (N = 6) and ChR2 (N = 10) groups in the low-threat context on i, freezing during WN (LED-on vs LED-off, paired t-test, ChR2, t=7.135, df=9) and j, flight scores during WN (LED-on vs LED-off, paired t-test, ChR2, t=t=2.717, df=9). Box and whisker plots in c indicate median, interquartile range, and min. to max. of the distribution, crosses indicate means. Data in d-e and h represented as mean ± s.e.m, and as mean with individual data points in f,g,i,j. Two-sided statistical tests were used. ***P < 0.001, **P < 0.01, *P < 0.05.
Extended data Figure 9: (Data related to Figure 5): Optogenetically evoked responses in central amygdala neurons.
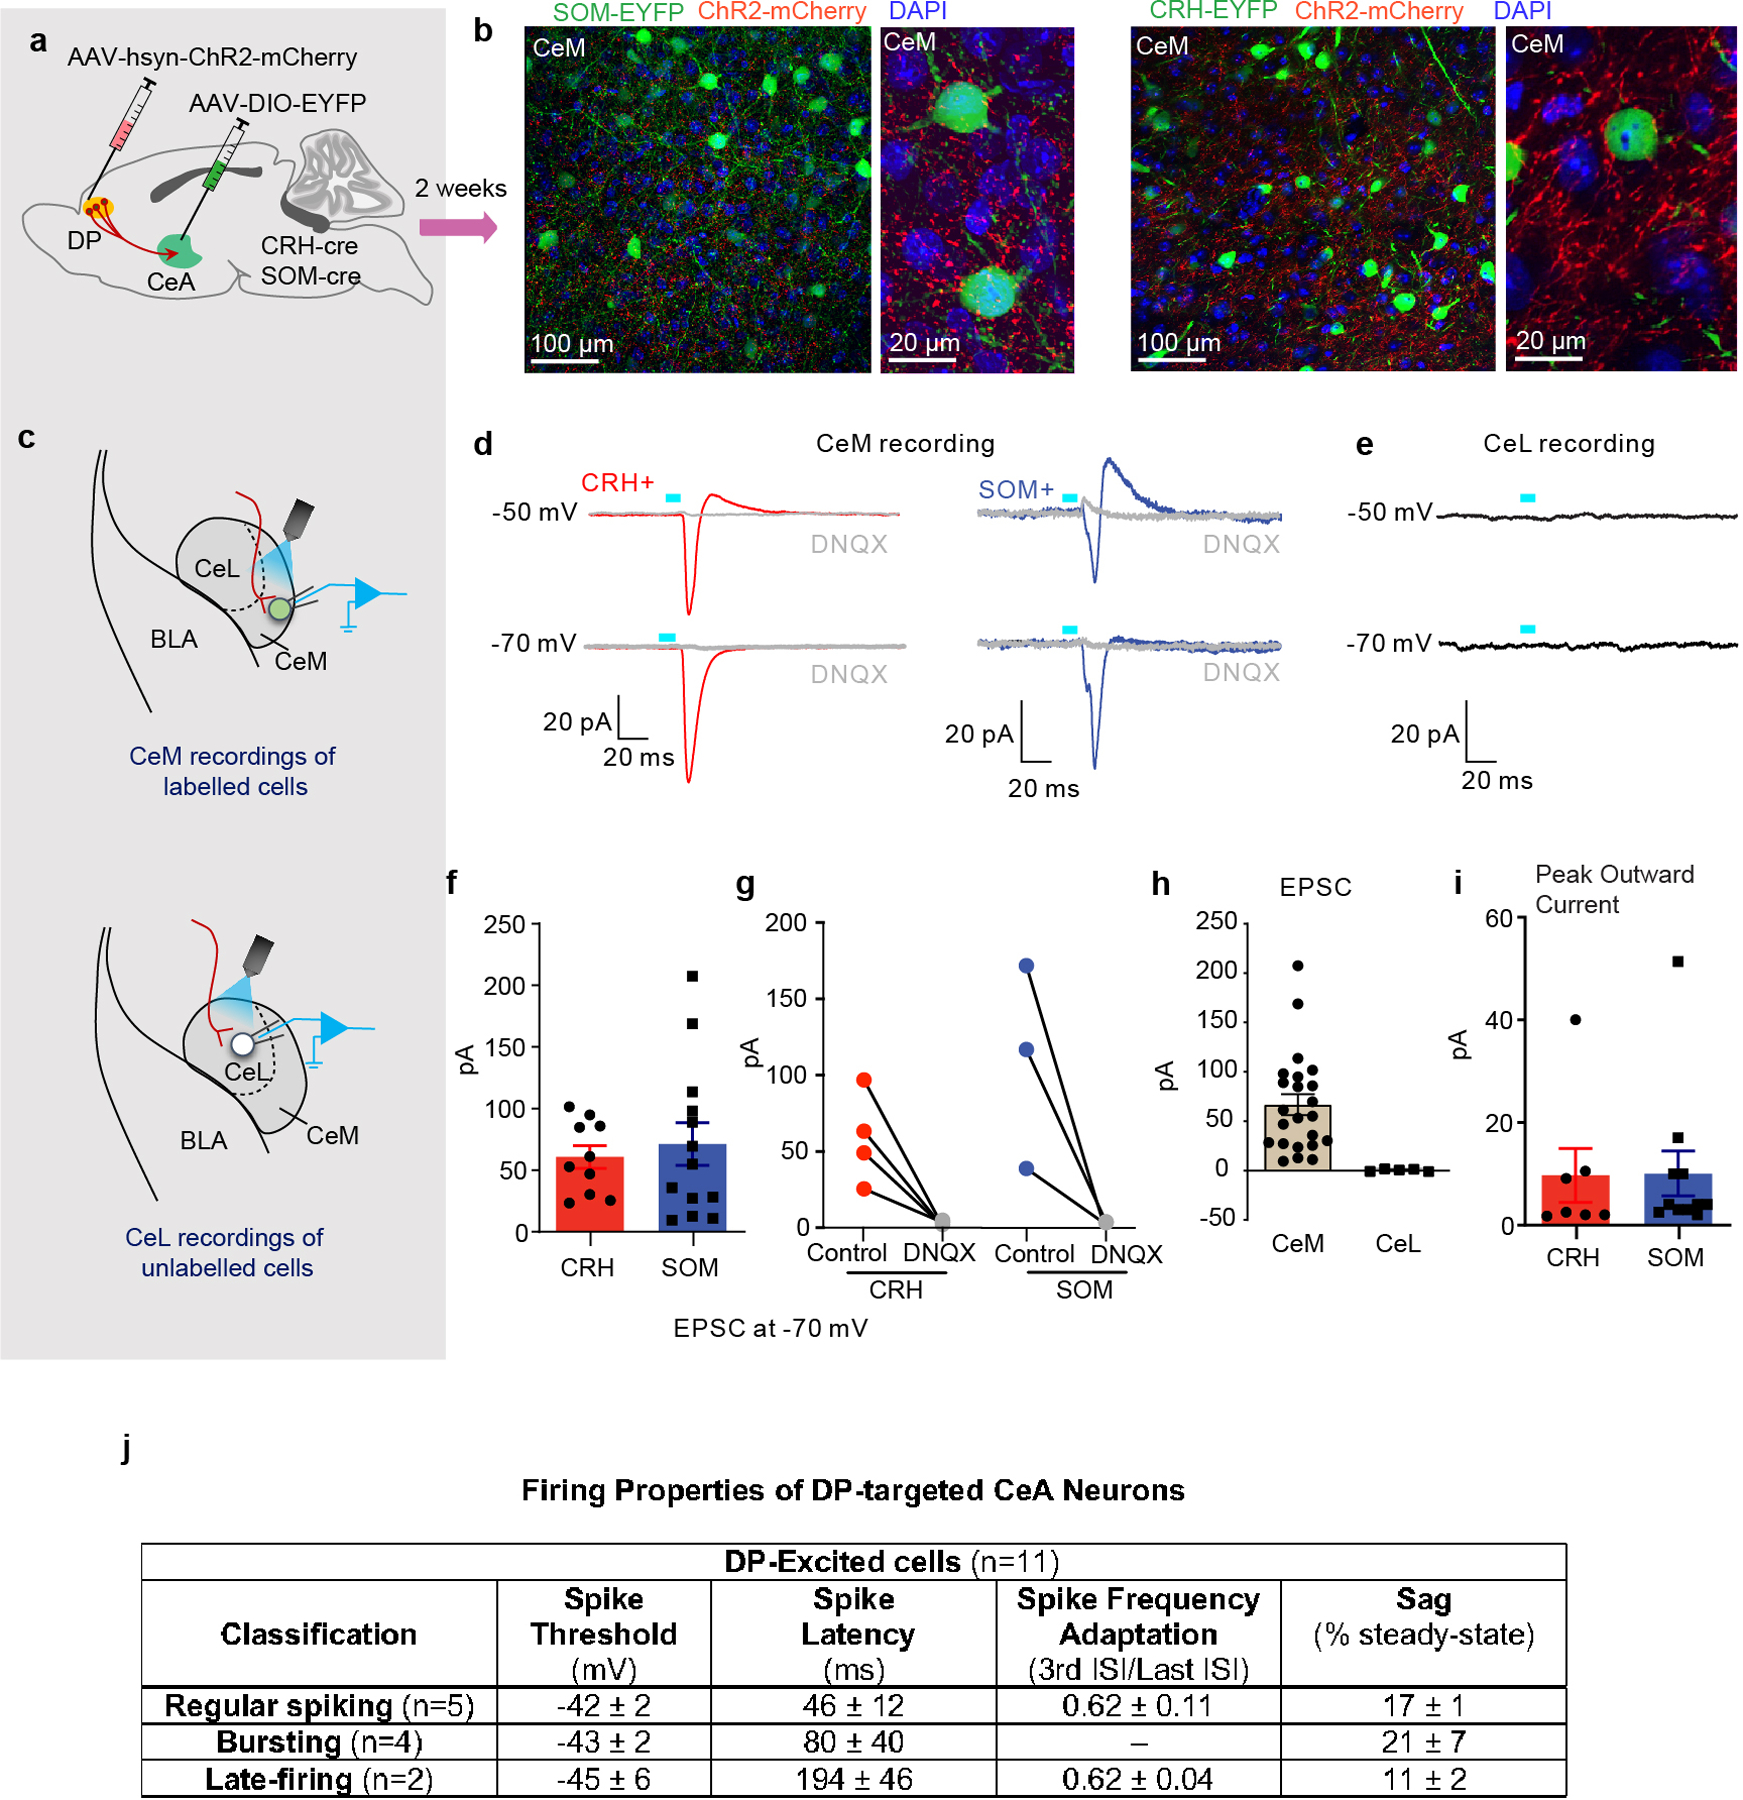
a, Schematic of targeting strategy. b, DP terminals in CeM near SOM+ (left) and CRH+ (right) cells at 20x and 40x magnification. c, Strategy for recording light-evoked synaptic input from DP to SOM+ or CRH+ neurons from CeM (top) and CeL (bottom) regions. d, Representative evoked synaptic responses in CeM SOM+ and CRH+ cells by photostimulation of DP axonal fibres in voltage-clamp. e, Photostimulation of axonal fibres did not evoke responses in CeL neurons. f, Average amplitude of evoked EPSCs in CRH+ neurons (N = 10 cells from 3 mice) and SOM+ (N = 13 cells from 3 mice) at −70mV (unpaired Student’s t-test, t=0.4879, df=21, p = 0.63). g, Amplitudes of evoked EPSCs in CRH+ (N = 4 cells from 3 mice) and SOM+ (N = 3 cells from 2 mice) neurons at −70 mV, before and after application of DNQX. h, Average amplitude of evoked EPSCs in CeM (N = 23 cells from 6 mice) and CeL neurons (N = 5 cells from 2 mice). i, The amplitude of disynaptic IPSCs evoked by ChR2 stimulation of DP terminals in CRH+ (N = 7 cells from 3 mice) and SOM+ (N = 11 cells from 2 mice; unpaired Student’s t-test, t(16)= 0.055; p = 0.96) neurons at –50 mV. j, The firing properties of DP-targeted CeM neurons. Data in f,h,i represented as mean ± s.e.m. Two-sided statistical tests were used. ***P < 0.001, **P < 0.01, *P < 0.05.
Extended data Figure 10 (Data related to Figure 5): Brain regions targeted by CeM neurons receiving DP innervation.
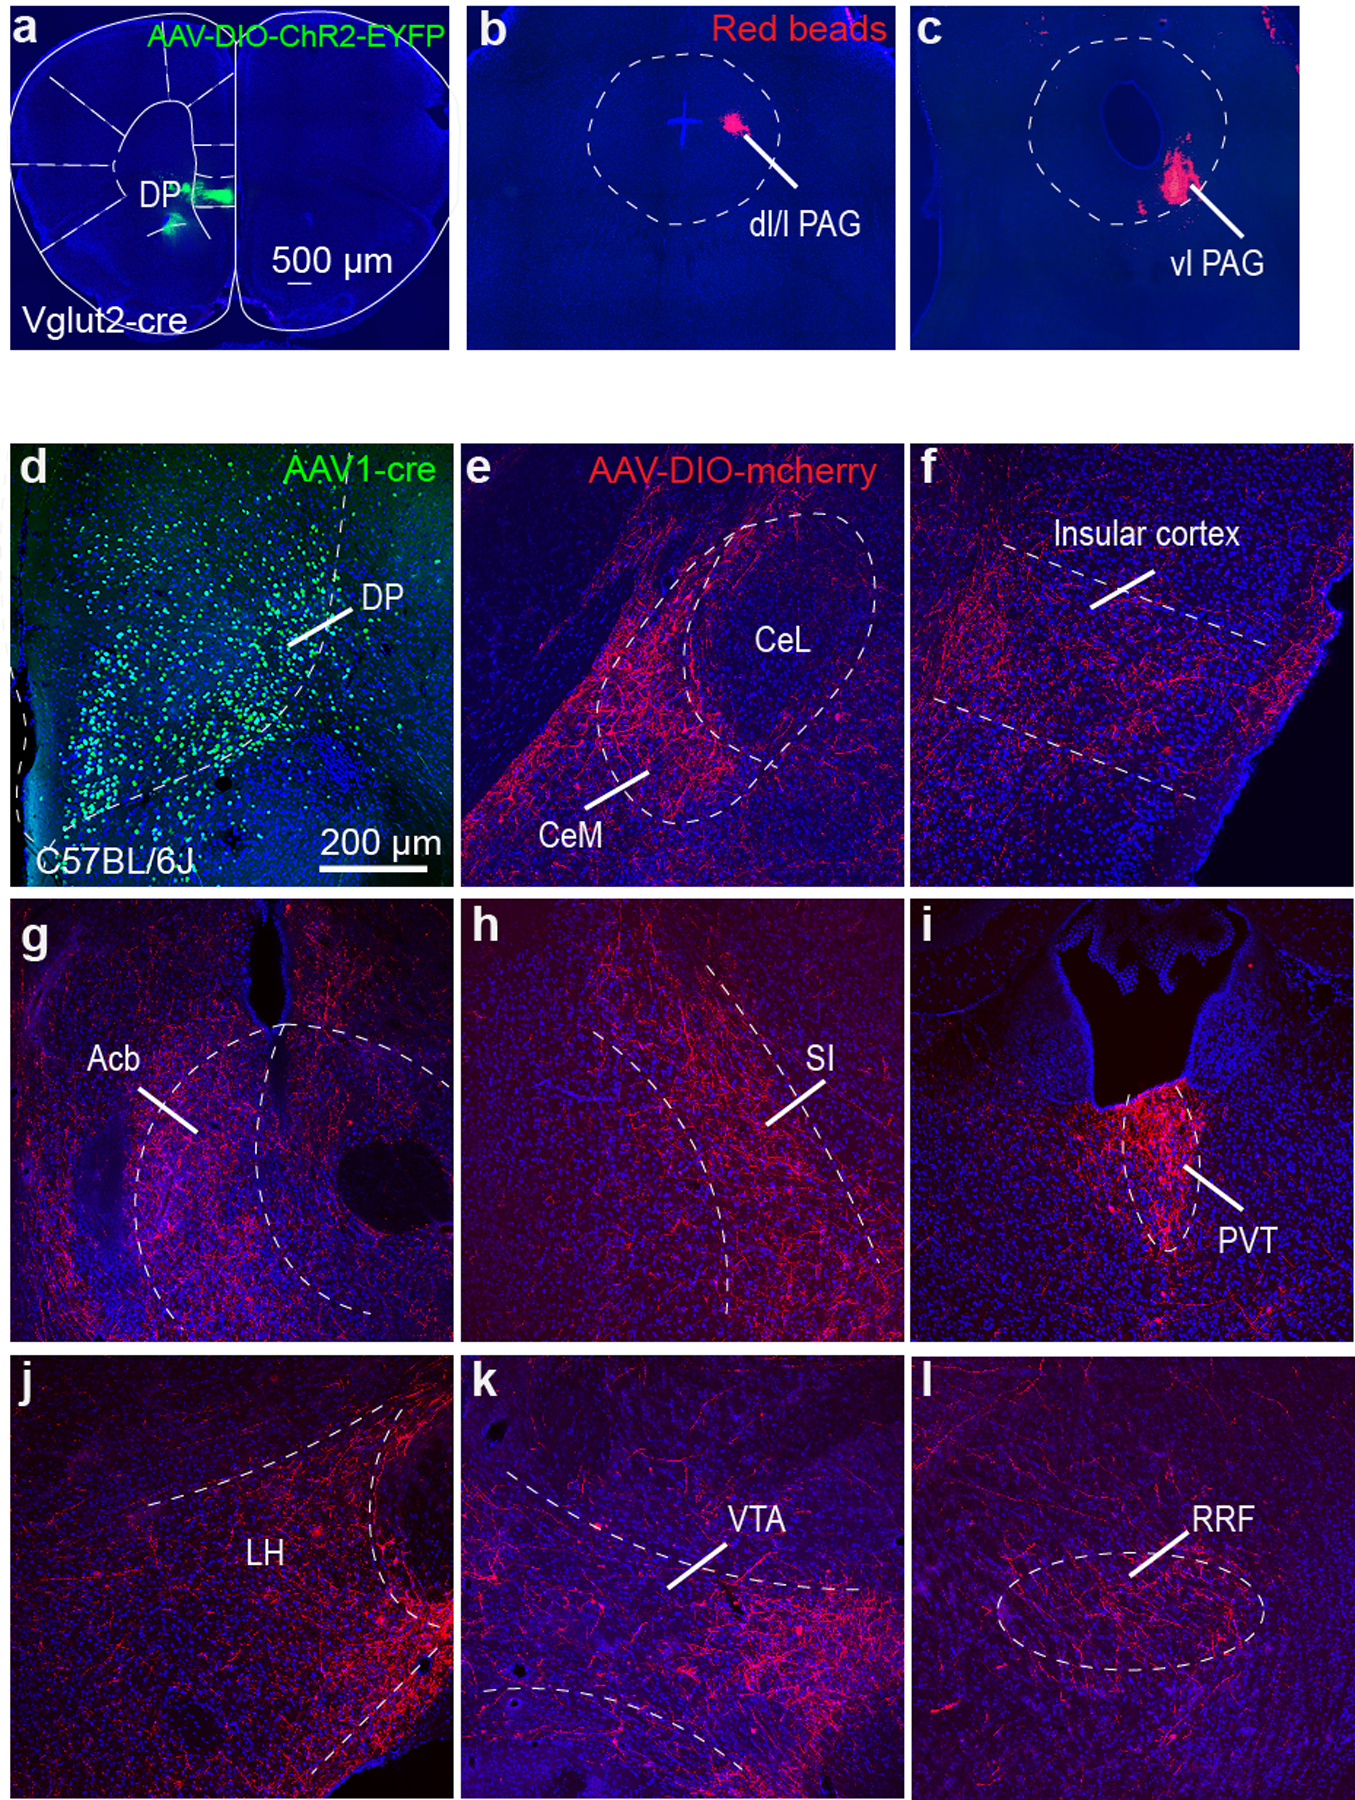
a, Representative image showing ChR2 injection targeting in the DP. b-c, Representative images showing targeting of red beads to the b, dorsal (dl/l PAG) and c, ventrolateral (vlPAG) periaqueductal gray regions for electrophysiological recordings of PAG-projecting CeM neurons. d, Representative expression of EYFP in the DP of a C57BL/6J mouse injected with AAV1-cre-EYFP. e, Cre-dependent mCherry expression in the CeM of the same mouse. f-l, mCherry+ terminals of CeM neurons innervated by the DP project to insular cortex (f), nucleus accumbens (Acb, g), substantia innominata (SI, h), periventricular thalamus (PVT, i), lateral hypothalamus (LH, j), ventral tegmental area (VTA, k), and retrorubral field (RRF, l).
Supplementary Material
Acknowledgements
We thank Dr. Biafra Ahanonu (University of California, San Francisco) for providing MATLAB codes and assistance with calcium imaging data analysis. We thank Dr. Ricardo Mostany (Tulane University, New Orleans) and Dr. Seongsik Yun (Northwestern University, Chicago) for help in standardization of calcium imaging and data analysis. This work was supported by the Louisiana Board of Regents through the Board of Regents support fund (LEQSF(2018-21)-RD-A-17) to JPF, the National Institute of Mental Health of the National Institutes of Health under award numbers R01MH122561 to JPF and R01MH119283 to JT, and the National Institute of Neurological Disorders and Stroke of the National Institutes of Health under award number R01NS122840 to JP. The content is solely the responsibility of the authors and does not necessarily represent the official views of the National Institutes of Health.
Footnotes
Competing Interest Statement
The authors declare no competing interests.
Additional Information
Correspondence and requests for materials should be addressed to JPF.
Data availability
All data supporting the findings of this study are available within the paper and its Supplementary Information.
References
- 1.Fonzo GA et al. PTSD Psychotherapy outcome predicted by brain activation during emotional reactivity and regulation. Am. J. Psychiatry 174, 1163–1174 (2017). [DOI] [PMC free article] [PubMed] [Google Scholar]
- 2.Fadok JP et al. A competitive inhibitory circuit for selection of active and passive fear responses. Nature 542, 96–99 (2017). [DOI] [PubMed] [Google Scholar]
- 3.Roelofs K Freeze for action: Neurobiological mechanisms in animal and human freezing. Philosophical Transactions of the Royal Society B: Biological Sciences vol. 372 (2017). [DOI] [PMC free article] [PubMed] [Google Scholar]
- 4.Fanselow MS, Hoffman AN & Zhuravka I Timing and the transition between modes in the defensive behavior system. Behav. Processes 166, 103890 (2019). [DOI] [PMC free article] [PubMed] [Google Scholar]
- 5.Blanchard DC & Blanchard RJ Defensive behaviors, fear, and anxiety. in Handbook of anxiety and fear 63–79 (Elsevier Academic Press, 2008). doi: 10.1016/S1569-7339(07)00005-7. [DOI] [Google Scholar]
- 6.Perusini JN & Fanselow MS Neurobehavioral perspectives on the distinction between fear and anxiety. Learn. Mem 22, 417–425 (2015). [DOI] [PMC free article] [PubMed] [Google Scholar]
- 7.Johnson PL, Truitt WA, Fitz SD, Lowry CA & Shekhar A Neural Pathways Underlying Lactate-Induced Panic. Neuropsychopharmacology 33, 2093–2107 (2008). [DOI] [PMC free article] [PubMed] [Google Scholar]
- 8.Münsterkötter AL et al. Spider or no spider? neural correlates of sustained and phasic fear in spider phobia. Depress. Anxiety 32, 656–663 (2015). [DOI] [PubMed] [Google Scholar]
- 9.Mobbs D et al. From threat to fear: The neural organization of defensive fear systems in humans. J. Neurosci 29, 12236–12243 (2009). [DOI] [PMC free article] [PubMed] [Google Scholar]
- 10.Tromp DPM et al. Reduced structural connectivity of a major frontolimbic pathway in generalized anxiety disorder. Arch. Gen. Psychiatry 69, 925–934 (2012). [DOI] [PMC free article] [PubMed] [Google Scholar]
- 11.Marek R, Strobel C, Bredy TW & Sah P The amygdala and medial prefrontal cortex: Partners in the fear circuit. J. Physiol 591, 2381–2391 (2013). [DOI] [PMC free article] [PubMed] [Google Scholar]
- 12.Senn V et al. Long-range connectivity defines behavioral specificity of amygdala neurons. Neuron 81, 428–437 (2014). [DOI] [PubMed] [Google Scholar]
- 13.Karalis N et al. 4-Hz oscillations synchronize prefrontal-amygdala circuits during fear behavior. Nat. Neurosci 19, 605–612 (2016). [DOI] [PMC free article] [PubMed] [Google Scholar]
- 14.Andrewes DG & Jenkins LM The role of the amygdala and the ventromedial prefrontal cortex in emotional regulation: implications for post-traumatic stress disorder. Neuropsychol. Rev 220–243 (2019). [DOI] [PubMed]
- 15.De Franceschi G, Vivattanasarn T, Saleem AB & Solomon SG Vision guides selection of freeze or flight defense strategies in mice. Curr. Biol 26, 2150–2154 (2016). [DOI] [PubMed] [Google Scholar]
- 16.Wang W et al. Coordination of escape and spatial navigation circuits orchestrates versatile flight from threats. Neuron 1–13 (2021). [DOI] [PMC free article] [PubMed]
- 17.Mcdonald AJ Cortical pathways to the mammalian amygdala. Prog. Neurobiol 55, 257–332 (1998). [DOI] [PubMed] [Google Scholar]
- 18.Kataoka N, Shima Y, Nakajima K & Nakamura K A central master driver of psychosocial stress responses in the rat. Science 367, 1105–1112 (2020). [DOI] [PubMed] [Google Scholar]
- 19.Anastasiades PG & Carter AG Circuit organization of the rodent medial prefrontal cortex. Trends Neurosci 44, 550–563 (2021). [DOI] [PMC free article] [PubMed] [Google Scholar]
- 20.Fremeau RT et al. The expression of vesicular glutamate transporters defines two classes of excitatory synapse. Neuron 31, 247–260 (2001). [DOI] [PubMed] [Google Scholar]
- 21.Borkar CD & Fadok JP A novel pavlovian fear conditioning paradigm to study freezing and flight behavior. J Vis Exp 1–13 (2021). doi: 10.3791/61536. [DOI] [PMC free article] [PubMed]
- 22.Anderson DJ & Adolphs R A framework for studying emotions across species. Cell 157, 187–200 (2014). [DOI] [PMC free article] [PubMed] [Google Scholar]
- 23.Fadok JP, Markovic M, Tovote P & Lüthi A New perspectives on central amygdala function. Curr. Opin. Neurobiol 49, 141–147 (2018). [DOI] [PubMed] [Google Scholar]
- 24.Dumont ÉC, Martina M, Samson RD, Drolet G & Paré D Physiological properties of central amygdala neurons: Species differences. Eur. J. Neurosci 15, 545–552 (2002). [DOI] [PubMed] [Google Scholar]
- 25.Duvarci S, Popa D & Paré D Central amygdala activity during fear conditioning. J. Neurosci 31, 289–294 (2011). [DOI] [PMC free article] [PubMed] [Google Scholar]
- 26.Li JN & Sheets PL The central amygdala to periaqueductal gray pathway comprises intrinsically distinct neurons differentially affected in a model of inflammatory pain. J. Physiol 596, 6289–6305 (2018). [DOI] [PMC free article] [PubMed] [Google Scholar]
- 27.Rizvi TA, Ennis M, Behbehani MM & Shipley MT Connections between the central nucleus of the amygdala and the midbrain periaqueductal gray: Topography and reciprocity. J. Comp. Neurol 303, 121–131 (1991). [DOI] [PubMed] [Google Scholar]
- 28.Tovote P et al. Midbrain circuits for defensive behaviour. Nature 534, 206–212 (2016). [DOI] [PubMed] [Google Scholar]
- 29.Bandler R & Carrive P Integrated defence reaction elicited by excitatory amino acid microinjection in the midbrain periaqueductal grey region of the unrestrained cat. Brain Res 439, 95–106 (1988). [DOI] [PubMed] [Google Scholar]
- 30.Behbehani MM Functional characteristics of the midbrain periaqueductal gray. Prog. Neurobiol 46, 575–605 (1995). [DOI] [PubMed] [Google Scholar]
- 31.Keifer OP, Hurt RC, Ressler KJ & Marvar PJ The physiology of fear: Reconceptualizing the role of the central amygdala in fear learning. Physiology 30, 389–401 (2015). [DOI] [PMC free article] [PubMed] [Google Scholar]
- 32.Ressler RL & Maren S Synaptic encoding of fear memories in the amygdala. Curr. Opin. Neurobiol 54, 54–59 (2019). [DOI] [PMC free article] [PubMed] [Google Scholar]
- 33.Kong MS & Zweifel LS Central amygdala circuits in valence and salience processing. Behav. Brain Res 410, 113355 (2021). [DOI] [PMC free article] [PubMed] [Google Scholar]
- 34.Li H et al. Experience-dependent modification of a central amygdala fear circuit. Nat. Neurosci 16, 332–339 (2013). [DOI] [PMC free article] [PubMed] [Google Scholar]
- 35.Hunt S, Sun Y, Kucukdereli H, Klein R & Sah P Intrinsic circuits in the CeL. eNeuro 4, 1–18 (2017). [DOI] [PMC free article] [PubMed] [Google Scholar]
- 36.Viviani D et al. Oxytocin selectively gates fear responses through distinct outputs from the central amygdala. Science 333, 104–107 (2011). [DOI] [PubMed] [Google Scholar]
- 37.Massi L et al. Disynaptic specificity of serial information flow for conditioned fear. Sci. Adv 9, 1–9 (2023). [DOI] [PMC free article] [PubMed] [Google Scholar]
- 38.Assareh N, Sarrami M, Carrive P & McNally GP The organization of defensive behavior elicited by optogenetic excitation of rat lateral or ventrolateral periaqueductal gray. Behav. Neurosci 130, 406–414 (2016). [DOI] [PubMed] [Google Scholar]
- 39.Yu H et al. Periaqueductal gray neurons encode the sequential motor program in hunting behavior of mice. Nat. Commun 12, (2021). [DOI] [PMC free article] [PubMed] [Google Scholar]
- 40.La-Vu MQ et al. Sparse genetically defined neurons refine the canonical role of periaqueductal gray columnar organization. Elife 11, 1–26 (2022). [DOI] [PMC free article] [PubMed] [Google Scholar]
- 41.Evans DA., Stempel AV., Vale R., Ruehle S, Lefler Y, Branco T. A synaptic threshold mechanism for computing escape decisions. Nature 558, 46–76 (2009). [DOI] [PMC free article] [PubMed] [Google Scholar]
- 42.Wang W et al. Dorsal premammillary projection to periaqueductal gray controls escape vigor from innate and conditioned threats. Elife 10, 1–30 (2021). [DOI] [PMC free article] [PubMed] [Google Scholar]
- 43.Tovote P, Fadok JP & Lüthi A Neuronal circuits for fear and anxiety. Nat. Rev. Neurosci 16, 317–331 (2015). [DOI] [PubMed] [Google Scholar]
- 44.Quirk GJ, Likhtik E, Pelletier JG & Paré D Stimulation of medial prefrontal cortex decreases the responsiveness of central amygdala output neurons. J. Neurosci 23, 8800–8807 (2003). [DOI] [PMC free article] [PubMed] [Google Scholar]
- 45.Bukalo O et al. Prefrontal inputs to the amygdala instruct fear extinction memory formation. Sci. Adv 1, 1–9 (2015). [DOI] [PMC free article] [PubMed] [Google Scholar]
- 46.Hersman S, Allen D, Hashimoto M, Brito SI & Anthony TE Stimulus salience determines defensive behaviors elicited by aversively conditioned serial compound auditory stimuli. Elife 9, (2020). [DOI] [PMC free article] [PubMed] [Google Scholar]
- 47.Dong P et al. A novel cortico-intrathalamic circuit for flight behavior. Nat. Neurosci 22, 941–949 (2019). [DOI] [PubMed] [Google Scholar]
- 48.Totty MS et al. Behavioral and brain mechanisms mediating conditioned flight behavior in rats. Sci. Rep 11, 1–15 (2021). [DOI] [PMC free article] [PubMed] [Google Scholar]
- 49.Soudais C, Laplace-Builhe C, Kissa K & Kremer EJ Preferential transduction of neurons by canine adenovirus vectors and their efficient retrograde transport in vivo. FASEB Ja 15, 2283–2285 (2001). [DOI] [PubMed] [Google Scholar]
- 50.Resendez SL et al. Visualization of cortical, subcortical and deep brain neural circuit dynamics during naturalistic mammalian behavior with head-mounted microscopes and chronically implanted lenses. Nat. Protoc 11, 566–597 (2016). [DOI] [PMC free article] [PubMed] [Google Scholar]
- 51.Corder G et al. An amygdalar neural ensemble that encodes the unpleasantness of pain. cience 363, 276–281 (2019). [DOI] [PMC free article] [PubMed] [Google Scholar]
- 52.Ghosh KK et al. Miniaturized integration of a fluorescence microscope. Nat. Methods 8, 871–878 (2011). [DOI] [PMC free article] [PubMed] [Google Scholar]
- 53.Parker JG et al. Diametric neural ensemble dynamics in parkinsonian and dyskinetic states. Nature 557 (2018). [DOI] [PMC free article] [PubMed] [Google Scholar]
- 54.Chen C et al. Astrocytes amplify neuronal dendritic volume transmission stimulated by norepinephrine. Cell Rep 29, 4349–4361.e4 (2019). [DOI] [PMC free article] [PubMed] [Google Scholar]
Associated Data
This section collects any data citations, data availability statements, or supplementary materials included in this article.
Supplementary Materials
Data Availability Statement
All data supporting the findings of this study are available within the paper and its Supplementary Information.


