
Extended data Figure 3 (Data related to Figure 2): Calcium imaging in the high-threat and low-threat contexts.
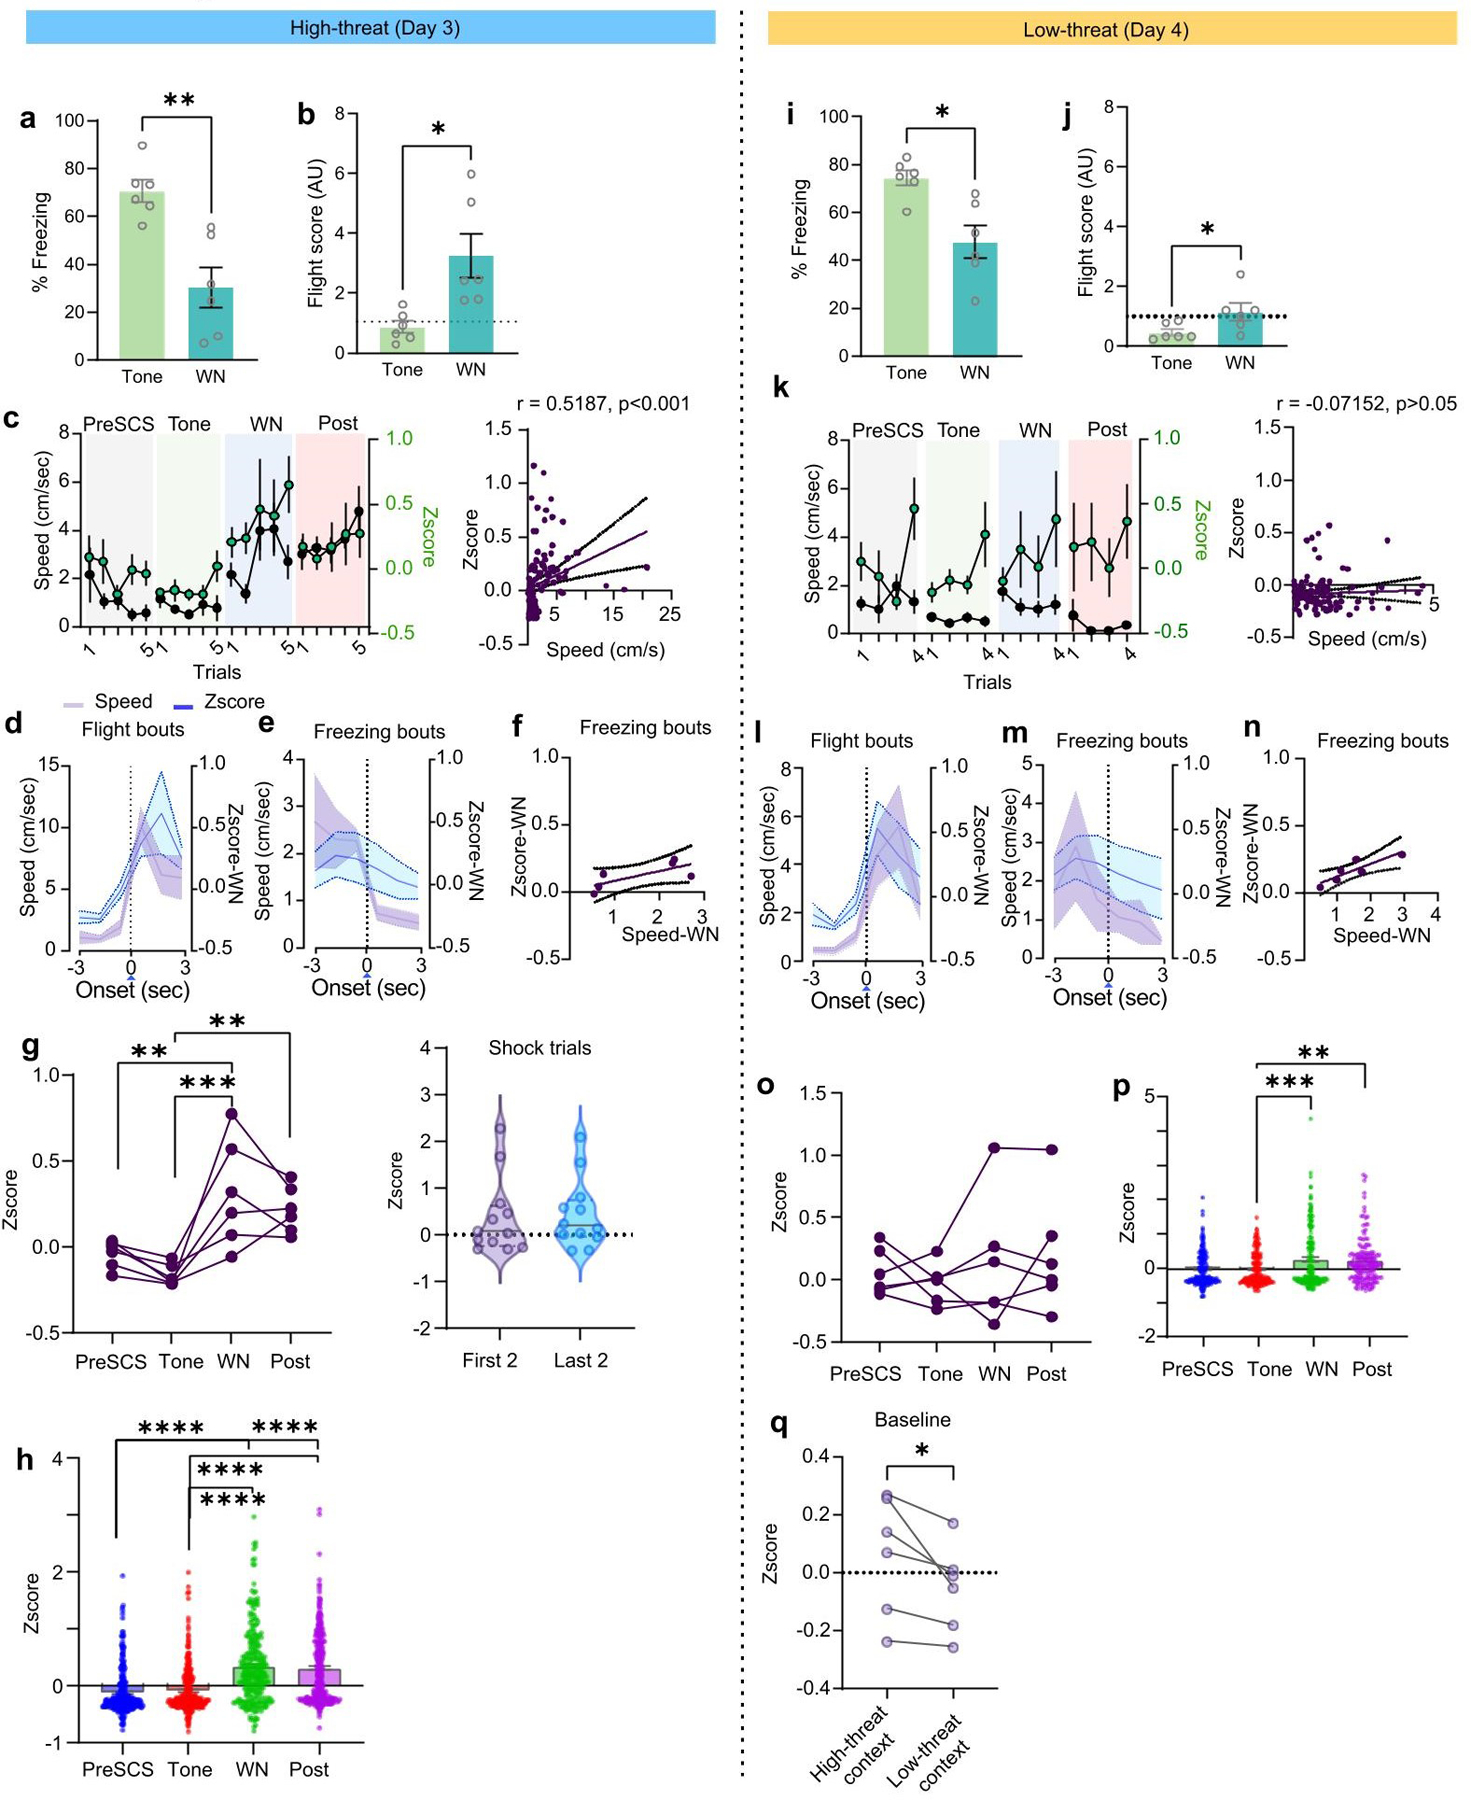
a, Freezing behaviour in the high-threat context (N = 6 mice; paired t-test, t=4.744, df=5). b, Flight scores in the high-threat context. (N = 6 mice; paired t-test, t=3.650, df=5). c, left, Average speed and neuronal activity during each trial of the preSCS, tone, WN and post-cue periods in the high-threat context (n = 273 cells from 6 mice). right, Spearman correlation of speed and neuronal activity from the last 3 trials (preSCS, tone, WN and post-cue epochs, each point represents data from 1 sec; n = 273 cells from 6 mice; r = 0.5187, 95% CI: 0.3696 to 0.6417, p<0.0001). d, Speed and neuronal activity aligned to the onset of flight bouts during WN in the high-threat context (n = 273 cells from 6 mice). e, Speed and neuronal activity aligned to the onset of freezing bouts during WN in the high-threat context (n = 273 cells from 6 mice). f, Spearman correlation plot for speed and Z-score from the identified freezing bouts (each dot represents values at each sec of the bouts, r = 0.657, 95% CI = −0.02019 to 0.1662, p = 0.175). g, left Z-scores of individual mice during preSCS, tone, WN and post-cue periods, across all trials (N = 6 mice; one-way ANOVA, F(3, 20) = 9.331, P=0.0005; Bonferroni’s multiple comparisons test). right, Z-scores of individual mice during first versus last 2 footshock periods (paired t-test, t=0.2289, df=11, each dot represents an individual mouse during a single trial). h, The Z-scores of individual neurons during preSCS, tone, WN and post-cue periods, from the last trial in the high-threat context (n = 273 cells from 6 mice, one-way ANOVA, F(3, 1112) = 59.01, P<0.0001; Bonferroni’s multiple comparisons test). i, Freezing in the low-threat context (N = 6 mice; paired t-test, t=3.424, df=5). j, Flight scores in the low-threat context. (N = 6 mice; paired t-test, t=2.889, df=5). k, left, Change in average speed and neuronal activity during preSCS, tone, WN and post-cue periods in the low-threat context over 4 trials (n = 273 cells from 6 mice). right, Spearman correlation of speed and neuronal activity from all recall trials in the low-threat context (preSCS, tone, WN and post cue epochs, each point represents 1 sec of data; n = 273 cells from 6 mice; r = −0.07152, 95% CI: −0.2526 to 0.1144, p = 0.43). l, Speed and neuronal activity aligned to the onset of flight bouts during WN in the low-threat context (n = 273 cells from 6 mice). m, Speed and neuronal activity aligned to the onset of freezing bouts during WN in the low-threat context (n = 273 cells from 6 mice). n, Spearman correlation of speed and neuronal activity from freezing bouts (n = 273 cells from 6 mice; each point represents one sec of data, r = 0.82, 95% CI = 0.02337 to 0.1669, P = 0.058). o, Population activity from individual mice during preSCS, tone, WN and post-cue periods, across all trials (N = 6 mice; one-way ANOVA, F(3,20) = 0.3923, P = 0.75). p, Neuronal activity of individual neurons during preSCS, tone, WN and post-cue periods, from the last trial in the low-threat context (n = 273 cells from 6 mice; one-way ANOVA, F(3,1008) = 5.566, P = 0.0009; Bonferroni’s multiple comparisons test). q, Z-scores of individual mice during context exposure (first 3 min baseline period) in high threat versus low-threat context (N = 6 mice; paired t-test, t=2.705, df=5). Data in a-c, d-e, h-k, l-m, and p represented as means ± s.e.m. Violin plots in g indicate median, interquartile range, and the distribution of individual data points. Two-sided statistical tests were used. ****P<0.0001, ***P < 0.001, **P < 0.01, *P < 0.05.