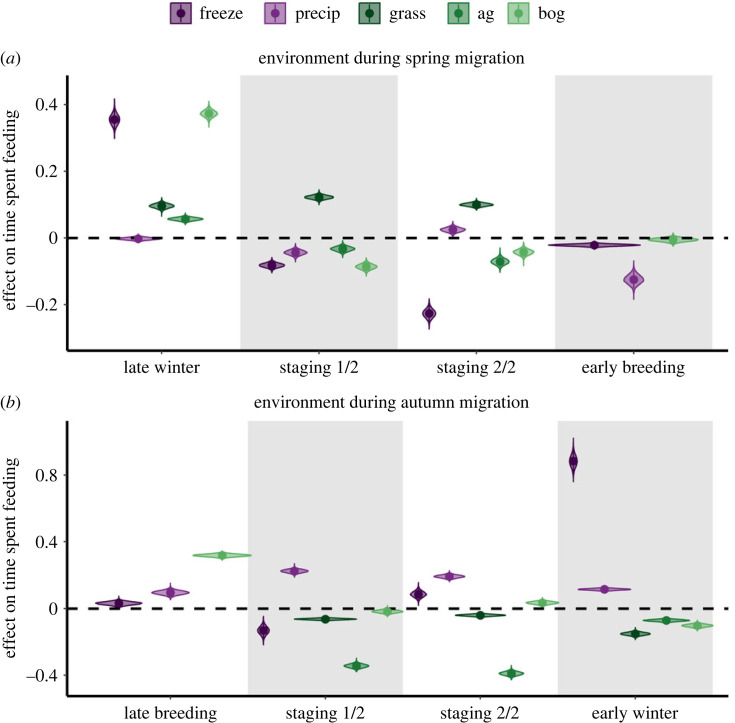
Figure 2.
Violin plots depicting the posterior distributions, as well as the median estimates (points) and 95% credible intervals (vertical lines) for each sub-seasonal-specific effect of: (a) the environment on time spent feeding during spring migration and (b) the environment on time spent feeding during autumn migration. Purple violins represent weather covariates and green violins represent habitat use covariates; freeze, proportion of days below freezing; precip, mean daily cumulative precipitation; grass, proportion of time in grasslands; ag, proportion of time in agriculture; bog, proportion of time in peat bogs.

