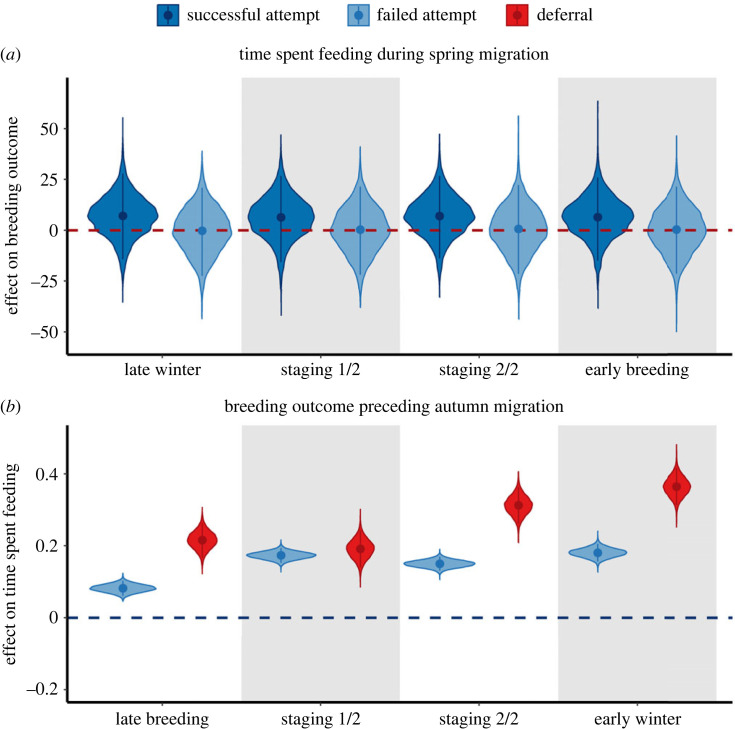
Figure 3.
Violin plots depicting the posterior distributions, as well as the median estimates (points) and 95% credible intervals (vertical lines) for each sub-seasonal-specific effect of: (a) time spent feeding during spring migration on breeding outcomes (i.e. successful/failed attempts with respect to deferrals) and (b) breeding outcomes (i.e. failed attempts/deferrals with respect to successful attempts) on time spent feeding during autumn migration.

