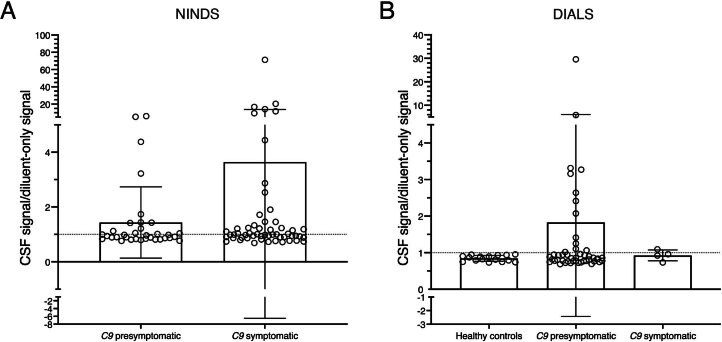
Extended Data Fig. 3. Cryptic HDGFL2 levels measured by MSD in C9orf72 mutation carriers from NINDS and DIALS cohorts.
(A) NINDS cohort CSF signal/diluent-only signal ratios. Of the symptomatic group (mean = 3.6, SD = 10.1, range = 0.69–71.2), 27/55 (49.1%) CSF samples had CSF/diluent signal ratios greater than 1, indicating elevated cryptic HDGFL2 signal. Of the presymptomatic group (mean = 1.4, SD = 1.3, range = 0.76–6.0), 13/34 (38.2%) CSF samples had CSF/diluent signal ratios greater than 1. Data are presented as mean +/- SD. Data points represent individual CSF samples. (B) DIALS cohort CSF signal/diluent-only signal ratios. Of the control group, 0/16 (0%) CSF samples had CSF/diluent ratios greater than 1. Of the symptomatic group, 1/4 (25.0%) CSF samples had CSF/diluent ratios greater than 1, and of the presymptomatic group, 13/47 (27.7%) CSF samples had CSF/diluent ratios greater than 1. The presymptomatic group had the highest average CSF/diluent signal ratio (mean = 1.8, SD = 4.2, range = 0.69–29.6) while the symptomatic group had the second highest average CSF/diluent signal ratio (mean = 0.93, SD = 0.15, range = 0.73–1.1). The control group had the lowest CSF/diluent signal ratio (mean = 0.85, SD = 0.08, range = 0.73–0.95). Data are presented as mean +/- SD. Data points represent individual CSF samples.

