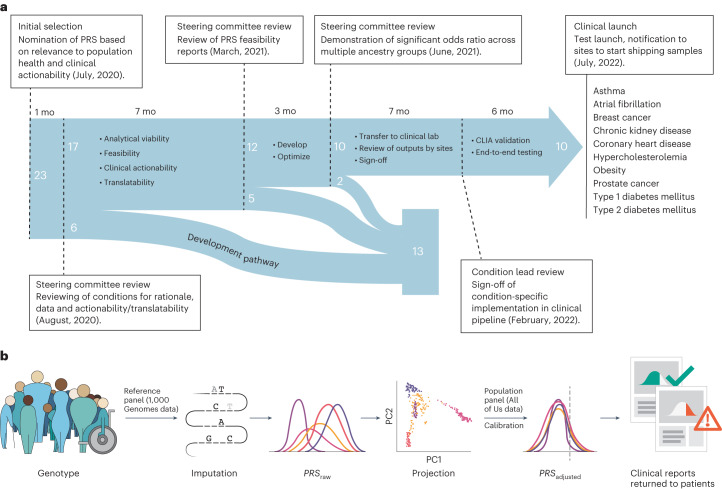
Fig. 1. Timeline and process overview.
a,Timeline and process for selection, evaluation, optimization, transfer, validation and implementation of the clinical PRS test pipeline. Dashed lines represent pivotal moments in the progression of the project with duration between these events indicated in months (mo) above the blue arrow. Numbers in white represent the number of conditions being examined at each stage and their fates. List of ten conditions on the right-hand side indicates the conditions that were implemented in the clinical pipeline for this study. b, Overview of the eMERGE PRS process. Participant DNA is genotyped using the Illumina Global Diversity Array, which assesses 1.8 million sites. Genotyping data are phased and imputed with a reference panel derived from the 1,000 Genomes Project. For each participant, raw PRSs are calculated for each condition (PRSraw). Each participant’s genetic ancestry is algorithmically determined in the projection step. For each condition, an ancestry calibration model is applied to each participant’s z-scores based on model parameters derived from the All of Us Research Program (Calibration) and an adjusted z-score is calculated (PRSadjusted). Participants whose adjusted scores cross the predefined threshold for high PRS are identified and a pdf report is generated. The report is electronically signed after data review by a clinical laboratory director and delivered to the study portal for return to the clinical sites.

