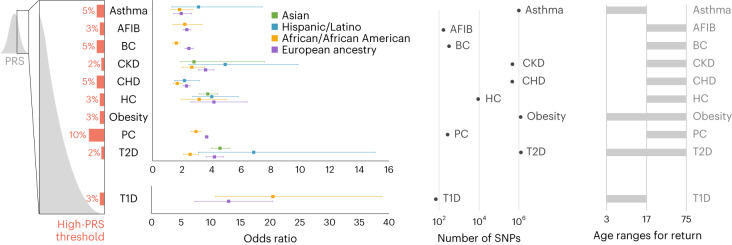
Fig. 2. Summary of the ten conditions that were implemented.
‘High-PRS threshold’ represents the percentile that is deemed to be the cutoff for a specific condition above which a high-PRS result is reported for that condition. Odds ratios are reported as the mean odds ratios (square dot) associated with having a score above the specified threshold, compared to having a score below the specified threshold, along with 95% confidence intervals (CIs), shown in the whiskers. The number of case and control samples used to derive these odds ratios and CIs for each condition can be found in Supplementary Table 2. Note that the odds ratio for obesity is not reported here, as it will be published by the Genetic Investigation of ANthropometric Traits consortium (Smit et al., manuscript in preparation). ‘Number of SNPs’ represents the range of numbers or sites included in each score. ‘Age ranges for return’ indicates the participant ages at which a PRS is calculated for a given condition. AFIB, atrial fibrillation; BC, breast cancer; CKD, chronic kidney disease; CHD, coronary heart disease; HC, hypercholesterolemia; PC, prostate cancer; T1D, type 1 diabetes; T2D, type 2 diabetes.

