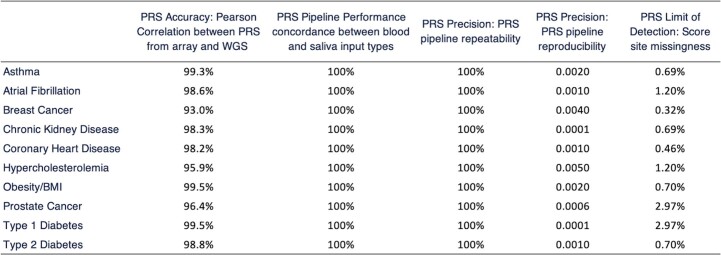
Extended Data Table 2.
Validation measures summary
PRS pipeline accuracy is assessed as the Pearson correlation between scores derived from PCR-free WGS and those derived from imputed genotyping data (GDA) in 70 specimens. Pearson correlation shown is the mean correlation across all ancestry groups tested.PRS pipeline performance as a function of sample input was assessed by comparing the scores from 20 matched blood and saliva pairs. PRS pipeline precision (repeatability) is the measure of concordance in PRS scores calculated from 70 specimens, run through the pipeline 10 times over the course of two weeks. PRS pipeline precision (reproducibility) is assessed using three samples, each run 6 times end-to-end and then compared in a pairwise manner and represented as the z-score standard deviation is used as a measure of variability. PRS Limit of Detection: score site missingness is the percentage of the original score sites that are missing from the final imputed dataset.

