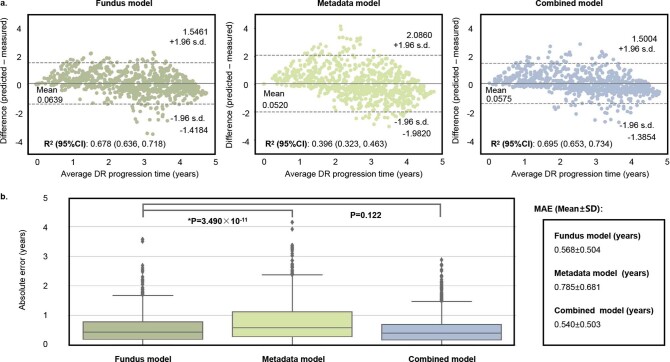
Extended Data Fig. 2. Model performance in predicting time to progression of eyes with DR progression in the internal test set and external validation dataset–1,2,4, and 5.
a, Bland–Altman plots for the agreement between the predicted and actual time to DR progression. The x axis represents the mean of predicted and actual time to DR progression (average DR progression time), and the y axis represents the difference between the two measurements. b, Box plots show the distribution of samples for the absolute error for three models (the fundus model, the metadata model and the combined model) (n = 859). The horizontal line indicates the median and the whiskers indicate the lowest and highest points within the interquartile ranges of the lower or upper quartile, respectively. Mann-Whitney U test was used for the comparison among the models. R2, coefficient of determination; MAE, mean absolute error.

