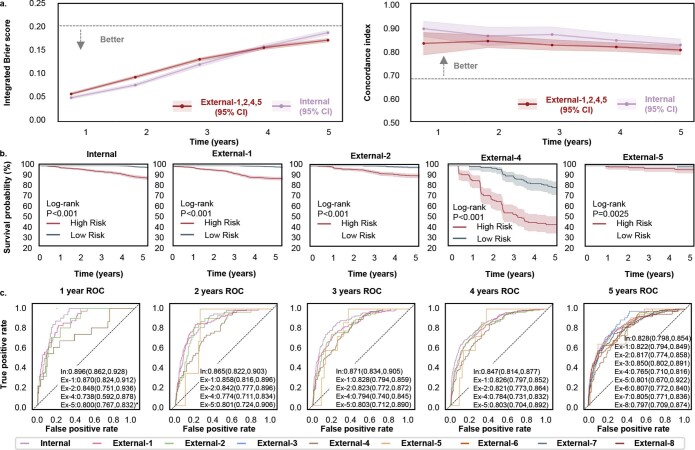
Extended Data Fig. 3. Internal and external validation of the DeepDR Plus system in the prediction of the progression from non-DR to DR.
a, Integrated Brier score (left) showing overall fit—lower is better and C-index (right) measuring model risk discrimination—higher is better—for various time points. b, Kaplan–Meier plots for the prediction of the progression from non-DR to DR. One-sided log-rank test was used for the comparison between the low- and high-risk groups. The P values on internal test set and external validation dataset–1,2,4, and 5 are 6.638×10−38, 2.181×10−46, 5.453×10⁻¹⁶, 1.167×10⁻¹² and 2.508×10⁻³, respectively. c, Prediction of the progression from non-DR to DR using time-dependent ROC curves. *The 1-year ROC of External-5 where only one case of the progression from non-DR to DR occurred that year. Shaded areas in a and b are 95% CIs. Areas under ROC curves are presented as mean values (lower bound of 95% CI, upper bound of 95% CI).

