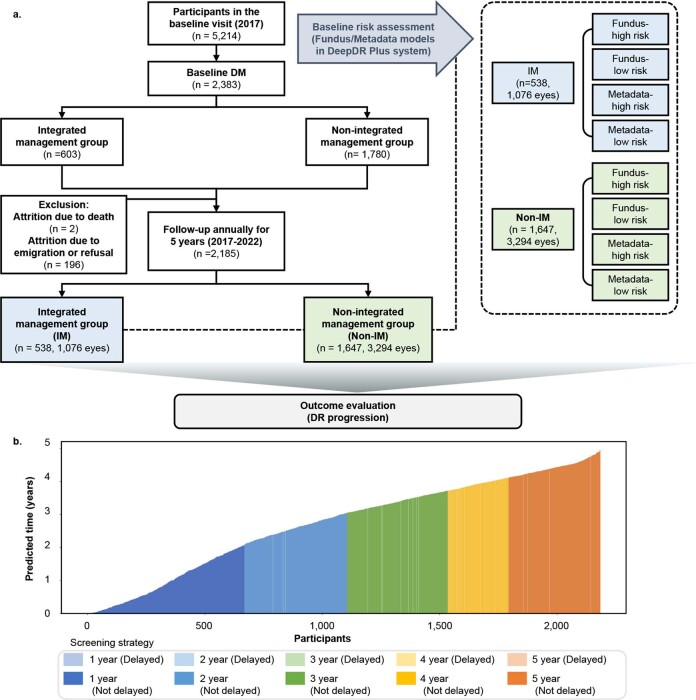
Extended Data Fig. 6. The real-world study to assess the clinical outcome by integration with DeepDR Plus system.
a, Flowchart of the study and actual DR progression rate among high-risk and low-risk evaluated by the Fundus and Metadata models in IM group and Non-IM group. b, Waterfall plot of predicted time to DR progression of participants in the real-world study by fundus model (DeepDR Plus). The waterfall plot displays the predicted time to DR progression of all participants in the real-world study by the fundus model. The individualized screening interval was set at an annual time point from baseline, which was just the year after the predicted patient-specific time to DR progression by the fundus model.

