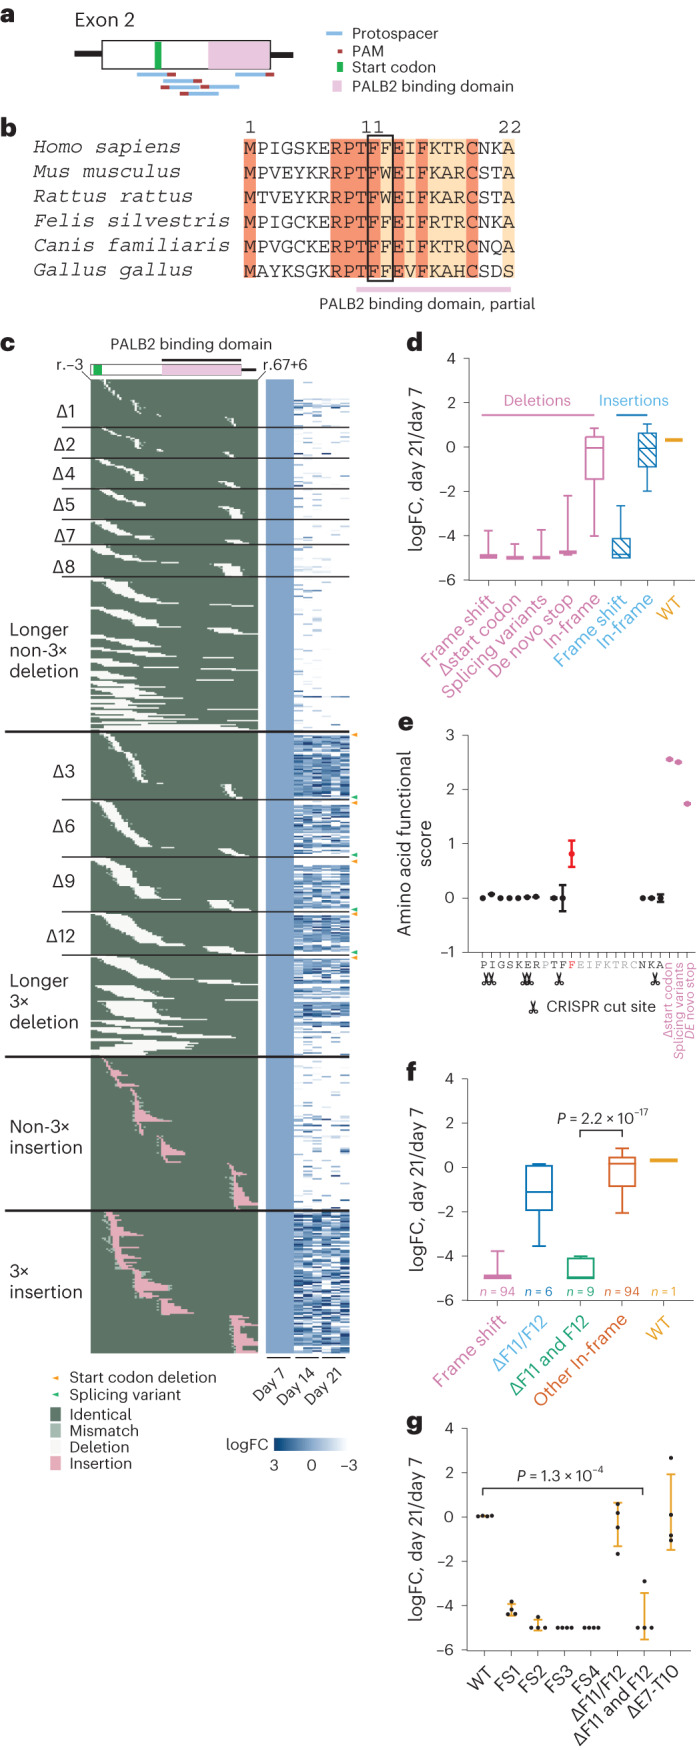
Fig. 5. Using BRCA2 loHAPs to identify critical amino acids by CRISPR-mediated mutation tiling in BRCA2 exon 2.

a, Schematic of editing strategy in the mutation tiling experiments on BRCA2 exon 2. Shown are protospacers (blue), PAMs (red), start codon (green) and the part of PALB2 binding domain in exon 2 (pink). b, Sequence alignment of amino acids encoded by BRCA2 exon 2 across multiple species. Identical amino acids are marked dark brown, and conserved amino acids are marked light brown. The pink bar indicates the part of PALB2 binding domain in exon 2. The black box highlights the identified critical amino acid F11, F12. c, The aligned indel profile and heatmaps of allele frequency change over time of each mutation at the nucleotide level in each of the triplicate experiments. Indel category is indicated to the left (3×, multiples of 3) and sample labels at the bottom. The identity of each position of each allele is categorized and colour coded as identical to WT (dark green), mismatch (light green), deletion (white) and insertion (pink). Specific mutations shown are start codon deletion (orange arrowheads) and splicing variant (green arrowheads). Allele frequencies of each mutation in each replicate were normalized to the corresponding day 7 frequencies. A total of 679 alleles that appeared in all independent day 7 samples and had at least 20 reads in at least one sample were analysed. FC, fold change. d, Categorized allele frequency changes of in-frame and frame-shift alleles in exon 2 at day 21 compared with day 7, presented as log2(day 21/day 7). Boxes showing quartiles and whiskers showing the 10th and 90th percentile. e, Functional score of each amino acid in BRCA2 exon 2 calculated by a statistical model, with CRISPR cut site labelled. Only scores of amino acids covered by one amino acid deletion are plotted. The F12 with outstanding functional score is marked in red. Known detrimental mutation groups are shown in purple as positive controls. Dots indicate mean and error bars indicate standard deviation. f, Categorized allele frequency changes of F11, F12 deletions at day 21 compared with day 7, presented as log2(day 21/day 7). P value reports the significance between F11 and F12 double deletion (n = 9) versus other in-frame mutations (n = 94) in two-tailed Student’s t-test. Boxes showing quartiles and whiskers showing the 10th and 90th percentile. g, Normalized allele frequency changes of amino acid F11, F12 deletions at day 21 compared with day 7, presented as log2(day 21/day 7), in a targeted validation experiment, with allele category labels at the bottom. FS1-4, four examples for different frame-shift mutations and ΔE7-T10 for unaffected in-frame deletions. P value reports the significance between F11 and F12 double deletion versus WT in two-tailed Student’s t-test. n = 4 biological replicates. Error bar presents standard deviation.
