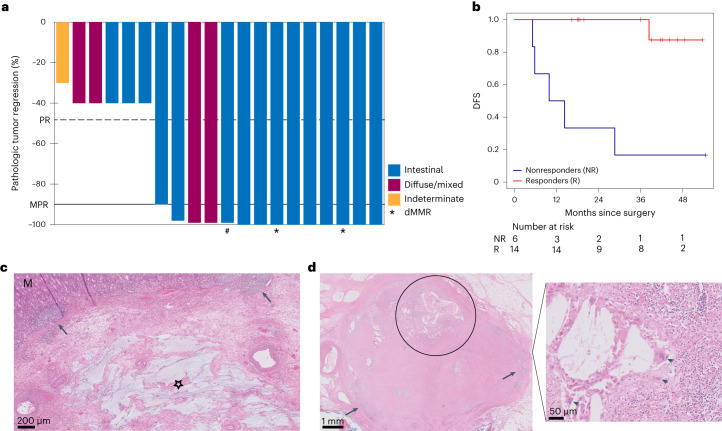
Fig. 1. Pathologic responses and outcomes after neoadjuvant atezolizumab plus DOC chemotherapy.
a, Percentage of pathologic regression shown per tumor. The black horizontal line depicts the demarcation for MPRs corresponding to 90% tumor regression. The dashed line demarcates PR (50% tumor regression). Colors of the bars represent different Lauren subtypes, the asterisks below bars indicate dMMR tumors, and the hash (#) indicates the patient with a pCR in the primary tumor but <1% RVT in lymph nodes. b, Kaplan–Meier plot of DFS for pathologic responders (red) versus nonresponders (blue) in patients evaluable for response in the PANDA trial. c, Posttreatment resection specimen from a patient with a pMMR GEJ tumor (cT3N1) who had a pCR. H&E stain showing normal mucosa (M) and complete regression of the adenocarcinoma, which was characterized by mucin lakes (star) and tertiary lymphoid structures (arrowheads). d, Posttreatment H&E stains of a resected lymph node from a patient with pretreatment clinical N3 stage. Left, some preexistent lymphoid tissue (arrowheads) and complete tumor regression characterized by cholesterol clefts (circle). Right, multinucleated giant cells (arrowheads).

