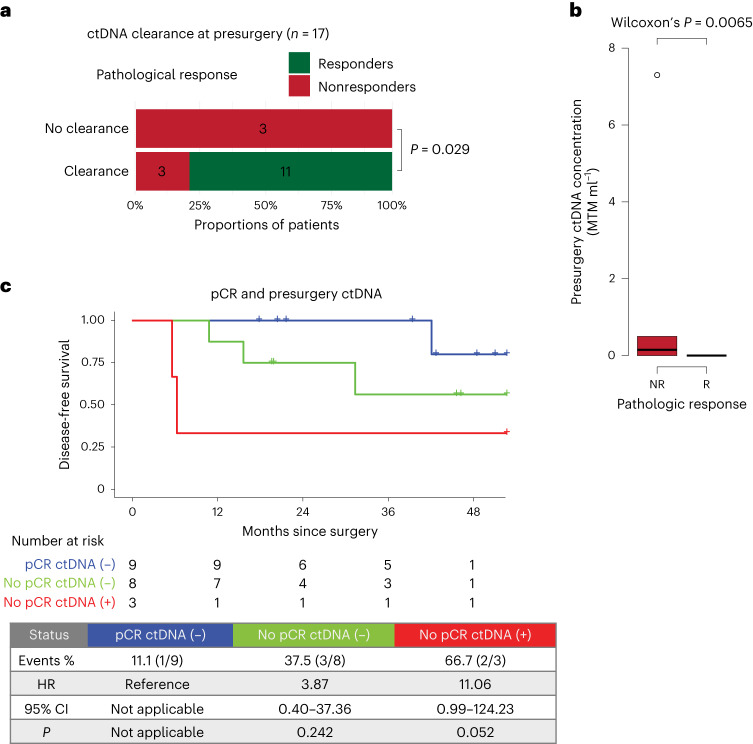
Fig. 2. Association of ctDNA with pathologic response.
a, Association between pathologic response and ctDNA clearance after all neoadjuvant treatment cycles and before surgery (n = 17). Significance was tested using a one-sided Fisher’s exact test. b, Average ctDNA concentration, in mean tumor molecules per milliliter of plasma (MTM per ml), across nonresponders (red, n = 6) and responders (green, n = 14). Box plots represent the median, 25th and 75th percentiles; the whiskers extend from the hinge to the largest value no farther than 1.5 × interquartile range (IQR) from the hinge. For comparison between nonresponders (red) and responders (green), significance was tested using a two-sided Wilcoxon rank-sum test. c, Kaplan–Meier plot of DFS stratified by combination of pathologic response (responders/nonresponders) and presurgery ctDNA status. Hazard ratios (HRs) and 95% CIs were calculated using the Cox proportional hazard model. P values were calculated using the two-sided log-rank test.

