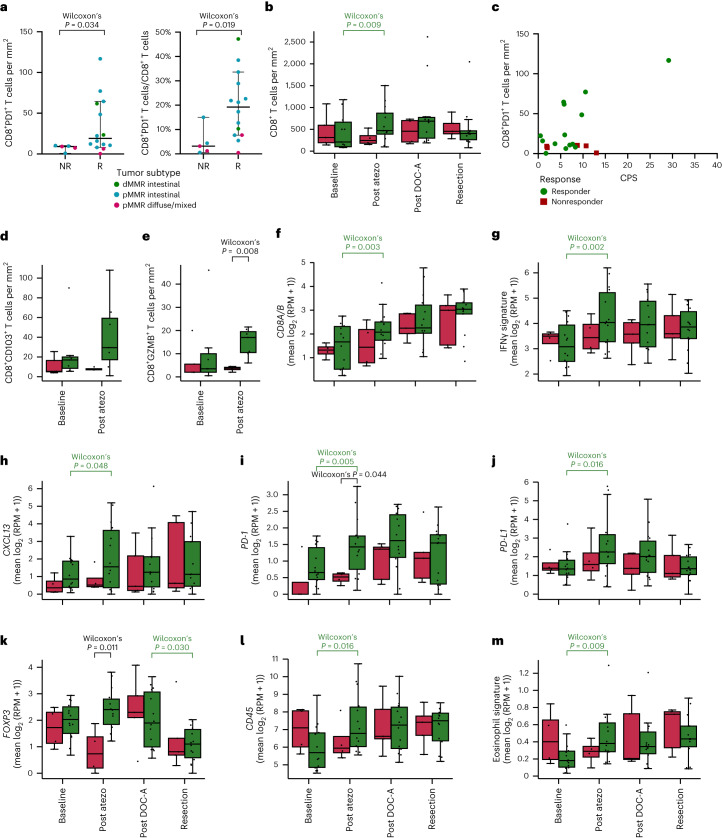
Fig. 3. IHC for CD8+PD-1+ TCI plus CD8+ TCI and dynamics of immune-related gene expression in predicting response to ICB plus chemotherapy.
a, Pretreatment CD8+PD-1+ T cells using IHC per mm2 (left) and as percentage of all CD8+ cells (right) in nonresponders (NR, n = 5) versus responders (R, n = 14). Dots represent individual patients. The horizontal line represents the median; whiskers show the 95% CIs. The difference between R and NR was tested using a two-sided Wilcoxon rank-sum test. b, Dynamics of CD8+ T cells per mm2 in R (green) versus NR (red) at baseline (R, n = 13; NR, n = 5) after monotherapy atezolizumab (post atezo; R, n = 13; NR, n = 4), after DOC plus atezolizumab (post DOC-A; R, n = 10; NR, n = 4) and at resection (R, n = 14; NR, n = 5). c, Scatter plot showing the relation between pretreatment PD-L1 CPS and CD8+PD-1+ T cells per mm2 in R (n = 14) versus NR (n = 5). Dots represent individual patients. d,e, Dynamics of CD8+CD103+ T cells per mm2 (d) and CD8+GZMB+ T cells per mm2 (e) analyzed by IMC in pMMR-complete responders (green) versus pMMR nonresponders (red) at baseline (R, n = 7; NR, n = 5) and after monotherapy atezolizumab (post atezo; R, n = 7; NR, n = 4). f–m, Dynamics of gene expression of CD8 (=CD8A + CD8B) (f). IFNγ signature (g). CXCL13 (h). PD-1 (i). PD-L1 (j). FOXP3 (k). CD45 (l). Eosinophil signature (m). f–m, Dynamics of gene expression in R (green) and NR (red) at baseline (R, n = 14; NR, n = 4) after monotherapy atezolizumab (post atezo; R, n = 14; NR, n = 4), after DOC plus atezolizumab (post DOC-A; R, n = 14; NR, n = 5) and at resection (R, n = 14; NR, n = 5). b,d–m, Box plots represent the median, 25th and 75th percentiles; whiskers extend from the hinge to the largest value below 1.5 × IQR from the hinge. Differences between R and NR were tested using a two-sided Wilcoxon rank-sum test. Differences between time points in R and NR separately were tested using a two-sided Wilcoxon signed-rank test. Only significant P values are shown; colors indicate a significant increase or decrease in responders (green) or a significant difference between responders and nonresponders (black). RPM, reads per million.

