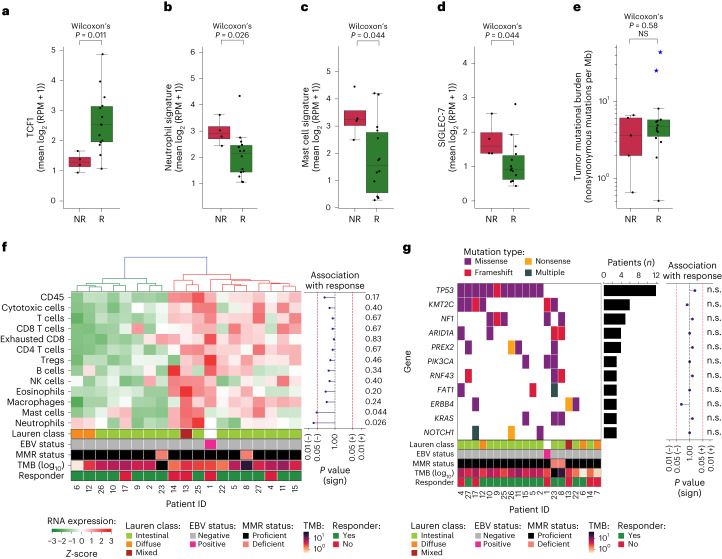
Fig. 4. Comparisons between responders and nonresponders of pretreatment TCF1 and SIGLEC-7 gene expression, neutrophil and mast cell signatures, TMB, infiltration of immune cell subsets and driver gene mutations.
a–d, Pretreatment gene expression in nonresponders (NR, n = 5) versus responders (R, n = 14) of TCF1 (a), neutrophil signature (b), mast cell signature (c) and SIGLEC-7 (d). Boxplots represent the median, 25th and 75th percentiles; whiskers extend from the hinge to the largest value below 1.5 * IQR from the hinge. The difference between NR and R was tested using a two-sided Wilcoxon Rank-sum test. e, TMB (number of nonsynonymous mutations per megabase of protein coding genome, y axis, log10scale) in nonresponders (NR, n = 5) versus responders (R, n = 14). Blue stars indicate patients with dMMR tumors. Box plots represent the median, 25th and 75th percentiles; whiskers extend from the hinge to the largest value below 1.5 × IQR from the hinge. The difference between NR and R was tested using a two-sided Wilcoxon rank-sum test. f, Heatmap of baseline RNA expression (Z-scores) of TME-specific signatures for leukocytes (CD45), cytotoxic cells, T cells, CD8 T cells, exhausted CD8 T cells, CD4 T cells, Treg cells, B cells, NK cells, eosinophils, macrophages, mast cells and neutrophils. Patients (x axis) were ordered on the basis of hierarchical clustering (upper dendrogram). The squares below indicate Lauren classification, EBV status, MMR status, TMB (log10scale) and pathologic response per patient. The association of signature expression with response is shown on the right as a lollipop plot of signed, two-sided Wilcoxon rank-sum test-based P values (unadjusted for multiple hypothesis testing; x axis on log10 scale). g, Mutational status of all cancer-driver genes altered in ≥3 patients (colors denote the mutation type), alteration frequency (bar plot) and association with response (lollipop plot of signed, two-sided Fisher’s exact test-based P values (unadjusted for multiple hypothesis testing; xaxis on log10 scale). The squares below indicate Lauren classification, EBV status, MMR status, TMB (log10 scale) and responder status per patient. n.s., not significant.

