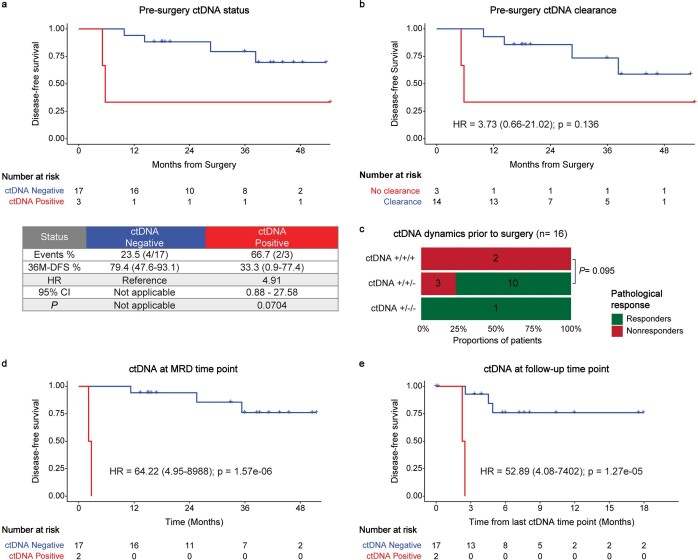
Extended Data Fig. 5. Association of ctDNA testing with clinical outcomes and pathologic response.
a, Kaplan-Meier plots of DFS stratified by ctDNA-negative and ctDNA-positive status or b, ctDNA clearance and no clearance at the pre-surgery time point. HRs and 95% CIs were calculated using the Cox proportional hazard model. Significance was calculated using the two-sided log-rank test. c, Association between pathologic response and ctDNA dynamics from baseline, after monotherapy atezolizumab and before surgery (n = 16). Group allocation: ctDNA +/+/+: no clearance prior to surgery; ctDNA +/+/−: clearance prior to surgery; ctDNA +/−/−: clearance after monotherapy atezolizumab. Significance was tested using one-sided Fisher’s exact test. d,e, Kaplan-Meier plots of DFS stratified by ctDNA-negative and ctDNA-positive status at the MRD (d) or follow-up (e) time point post-surgery. To account for immortal time bias, a landmark analysis was performed 12 weeks after surgery (d) and from the last ctDNA follow-up time point after surgery (e). HRs and 95% CIs were calculated using the Cox Regression with Firth’s Penalized Likelihood hazard model. Significance was calculated using a two-sided log-rank test. MRD: Molecular Residual Disease.

