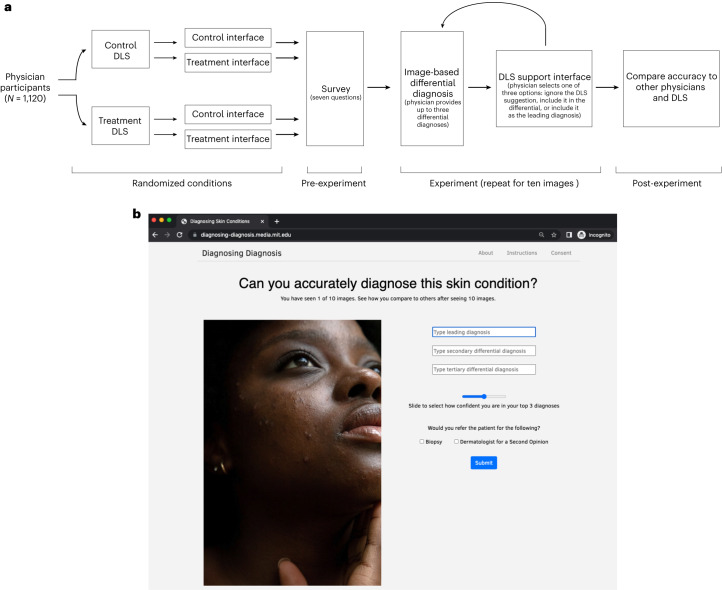
Fig. 1. Experimental design flowchart and user interface.
a, Flowchart describing the experimental design, including the number of participants, the randomly assigned conditions, the pre-experiment survey, the experiment, and the final stage, in which participants can see how they compare to other participants. b, Screenshot of the user interface for the image-based differential diagnosis portion of the experiment. Panel b reproduced with permission from Refinery29.

