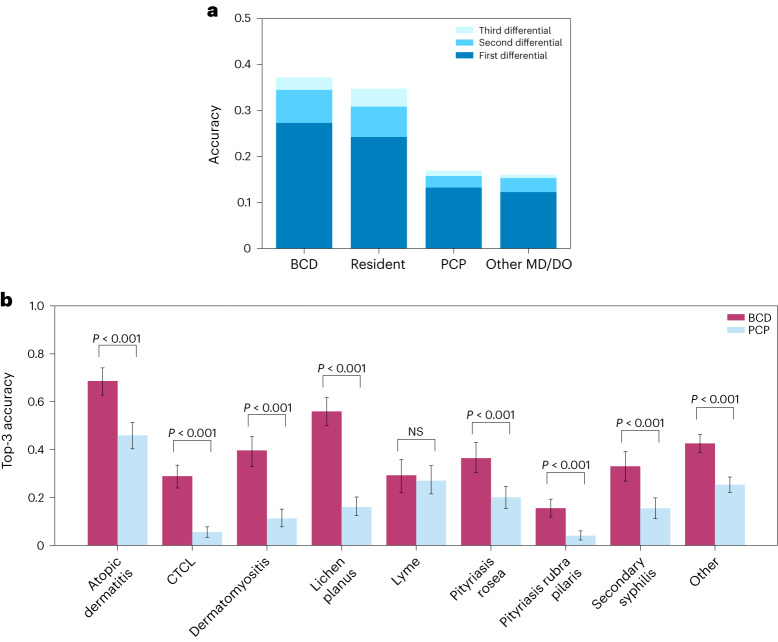
Fig. 2. Diagnostic accuracy across skin diseases.
a, Diagnostic accuracy of physician participants on the eight main skin diseases. Shades of blue indicate the diagnostic accuracy of the first, second and third differentials, respectively. ‘Resident’ refers strictly to dermatology residents. Other MD/DO refers to other physicians who have a doctor of medicine or doctor of osteopathic medicine degree. b, Top-3 diagnostic accuracy of BCDs (N = 296 physicians and N = 2,660 observations) and PCPs (N = 350 physicians and N = 3,150 observations) on each of the eight main skin diseases and the auxiliary 38 diseases, which are aggregated in the ‘Other’ category. All observations are represented as 1 or 0 for whether the submitted diagnoses match the consensus label or not. P values are calculated with a two-sided t-test. NS (not significant) indicates P > 0.05. Error bars represent the 95% confidence interval of the true mean.

