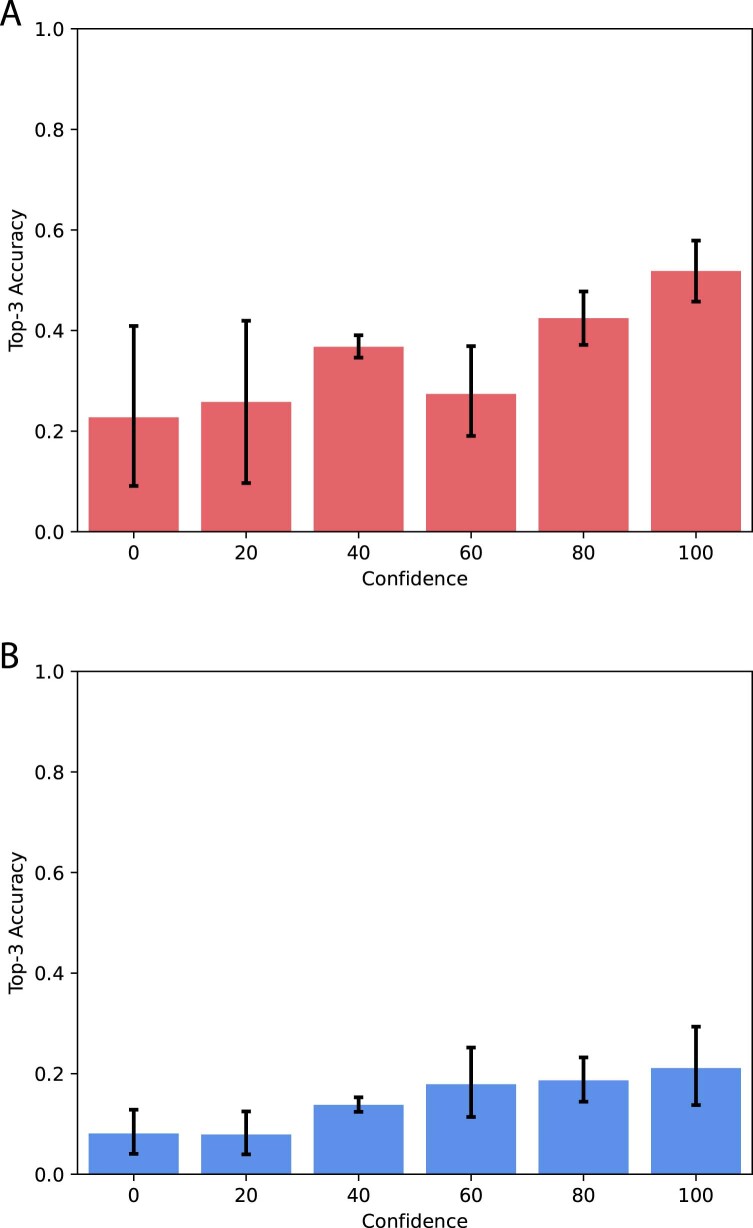
Extended Data Fig. 1. Diagnostic Accuracy by Reported Confidence.
A. BCD (N = 296 physicians and 2660 observations) top-3 accuracy by reported confidence. B. PCP (N = 350 physicians and 3150 observations) top-3 accuracy by reported confidence. The measure of center for error bars is the mean accuracy within the following confidence bands: 0–10, 15–25, 30–50, 55–65, 70–85, 90–100. Participants reported confidence with numbers divisible by 5 between 0 and 100. The error bars represent 95% confidence intervals and the confidence interval for the interval that includes 50% is particularly small in both graphs because 71% of BCDs and 70% of PCPs did not change their confidence level from the default of 50%.

