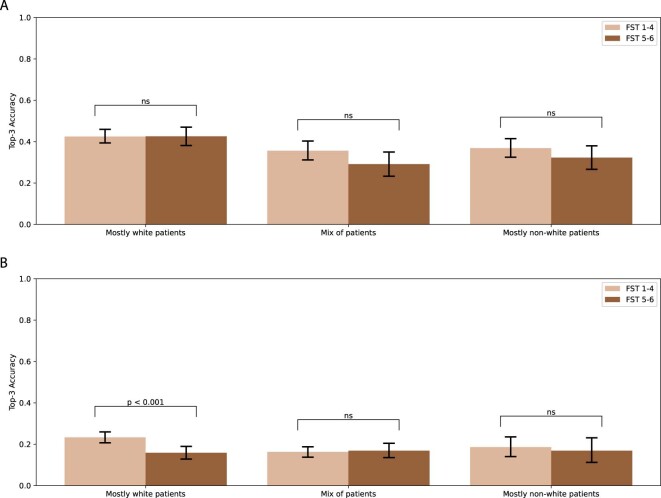
Extended Data Fig. 3. Diagnostic Accuracy by Providers’ Experience with Diverse Patients.
A. BCDs’ (N = 291 physicians and 2615 observations) top-3 accuracy B. PCPs’ (N = 343 physicians and 3087 observations) top-1 diagnosis on each of the 8 main skin diseases in this experiment. The categories on the x-axis are based on self-reported responses to “How would you describe the distribution of your patients’ skin color?” We exclude BCDs and PCPs who respond “Not Applicable.” P-values are calculated with a two-sided t-test and ns indicates that the p-value is greater than 0.05. The error bars represent the 95% confidence interval of the true mean.

