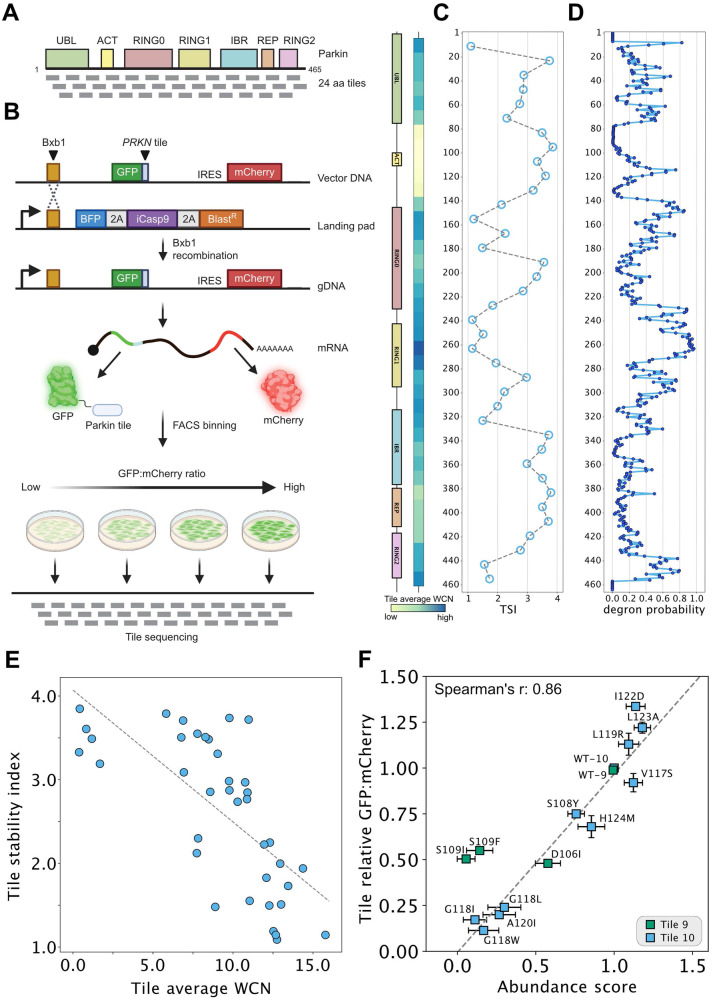
Fig. 4. Assessment of tile stability index to map degrons in Parkin.
A Schematic illustration of the linear architecture of Parkin divided into 38 tiles of 24 residues, each tile partially overlapping by 12 residues. B Schematic diagram of an adapted VAMP-seq approach applied to the 38 Parkin tiles as illustrated in panel A. Note that the approach is similar to that presented in Fig. 1A, except full-length Parkin variants were replaced with the 24-mer tiles. Moreover, the tile library is not barcoded hence tile sequencing is performed instead of barcode sequencing after sorting. Figure created with BioRender.com. C Tile stability index (TSI) assigned to the central position of each 24-mer tile. The two diagrams (left) show Parkin domains and average weighted contact numbers (WCN) with colors ramping from pale yellow (low WCN, corresponding to more exposed regions in the protein structure) to dark blue (high WCN, corresponding to more buried positions in the protein structure). D Predicted probabilities of 17-mer tiles being quality control degrons assigned to the central amino acid. E Scatterplot comparing the average WCN for each tile and TSI. Spearman’s r: −0.76. F Scatterplot comparing GFP:mCherry ratios determined individually for Parkin tile missense variants in low-throughput by flow cytometry (n = 3 biological replicates) and abundance scores derived from the VAMP-seq experiment for full-length Parkin variants. Spearman’s r: 0.86. The error bars indicate the standard deviation.

