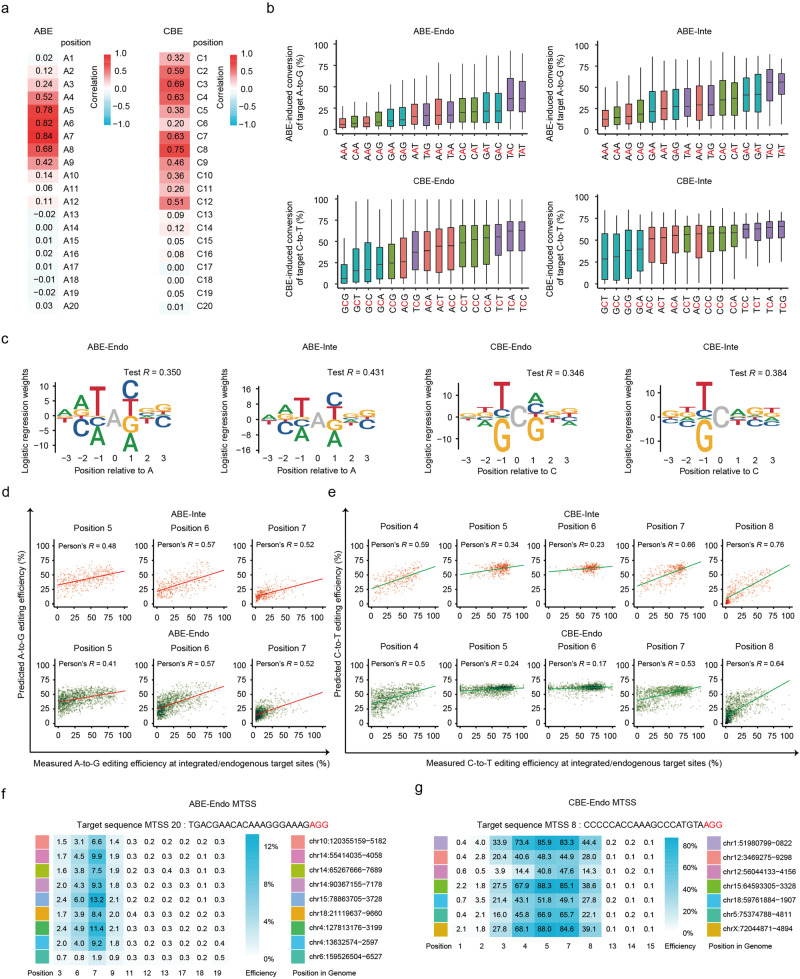
Fig. 2. Comparison of ABE- or CBE-induced base editing efficiency between endogenous and integrated target sites.
a Heatmap of correlation of ABE-induced A-to-G or CBE-induced C-to-T base editing efficiency between the Endo- and Inte-datasets at each protospacer positions 1–20 (PAM is at positions 21–23). n = 509 (position 1), 930; 1607, 809, 1343, 1250, 1106, 916, 916, 1157, 1269, 1493, 898, 1109, 1300, 1234, 936, 771, 910 and 1008 (position 20) for ABE. n = 576 (position 1), 1060, 563, 1025, 1181, 1040, 1195, 1343, 1082, 1079, 1065, 975, 1357, 1163, 938, 1156, 1136, 1889, 931 and 572 (position 20) for CBE. b Effect of the sequence context surrounding the target As or Cs (red) on the ABE- or CBE-directed base editing efficiency at endogenous and integrated target sites. n = 139 (AAA), 250 (AAC), 273 (AAG), 100 (AAT), 255 (CAA), 325 (CAC), 575 (CAG), 245 (CAT), 286 (GAA), 334 (GAC), 338 (GAG), 205 (GAT), 52 (TAA), 178 (TAC), 84 (TAG) and 60 (TAT) for ABE. n = 582 (ACA), 463 (ACC), 213 (ACG), 413 (ACT), 537 (CCA), 284 (CCC), 159 (CCG), 328 (CCT), 585 (GCA), 454 (GCC), 186 (GCG), 461 (GCT), 400 (TCA), 327 (TCC), 124 (TCG) and 268 (TCT) for CBE. c Sequence motifs for ABE- and CBE-directed base editing efficiency in the Endo- and Inte- datasets from logistic regression models. d, e Correlation between observed and predicted base editing efficiency from logistic models based on the ABE-Inte (d) or CBE-Inte (e) dataset. n = 403 (position 5), 375 and 331 (position 7) for ABE-Inte. n = 1342 (position 5), 1248 and 1105 (position 7) for ABE-Endo. n = 308 (position 4), 355, 312, 358 and 403 (position 8) for CBE-Inte. n = 1025 (position 4), 1181, 1040, 1194 and 1343 (position 8) for CBE-Endo. f, g ABE-directed A-to-G (MTSS 20) (f) or CBE-directed C-to-T (MTSS 8) (g) editing efficiency at representative MTSS sites. The target sequence of each MTSS site occurs 2–14 times in the genome.

