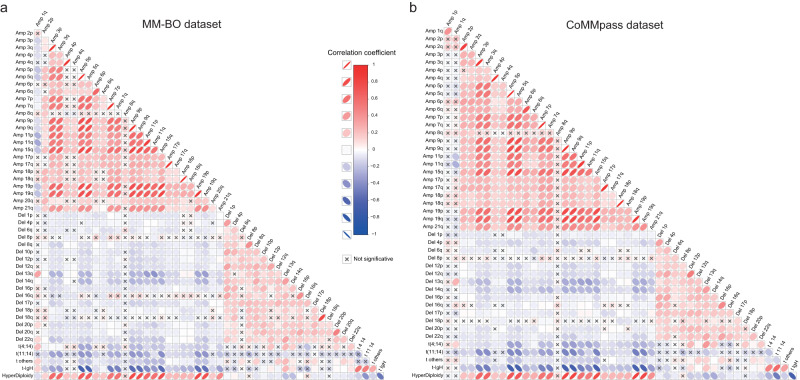
Fig. 2. Co-occurrence analysis.
Correlation matrices were built to highlight direct correlations between genomic variables. All aberrations (with frequency>5%) were included in the analysis for (a) BO dataset, n = 513 patients, and (b) CoMMpass dataset, n = 752 patients; rare aberrations were excluded from the plot but not from the analyses, to avoid an excessive scattering of the correlation matrix. The heatmap resumed results coming from Pearson correlation tests, performed for each couple of variables, as called when detected within a clonality range between 50% and 100%, as defined above. Direct and indirect correlations were both highlighted in red and blue, and defined by the ovals’ orientation (left-oriented and right-oriented ovals highlight direct and indirect correlations, respectively); the ovals’ transparency identified the correlation’s strength (strong and weak correlations are bold and light coloured, respectively). An X highlighted not-significant correlations (two-sided p > 0.05). The approach to multiple testing correction is described in methods section (Co-occurrence analysis).

