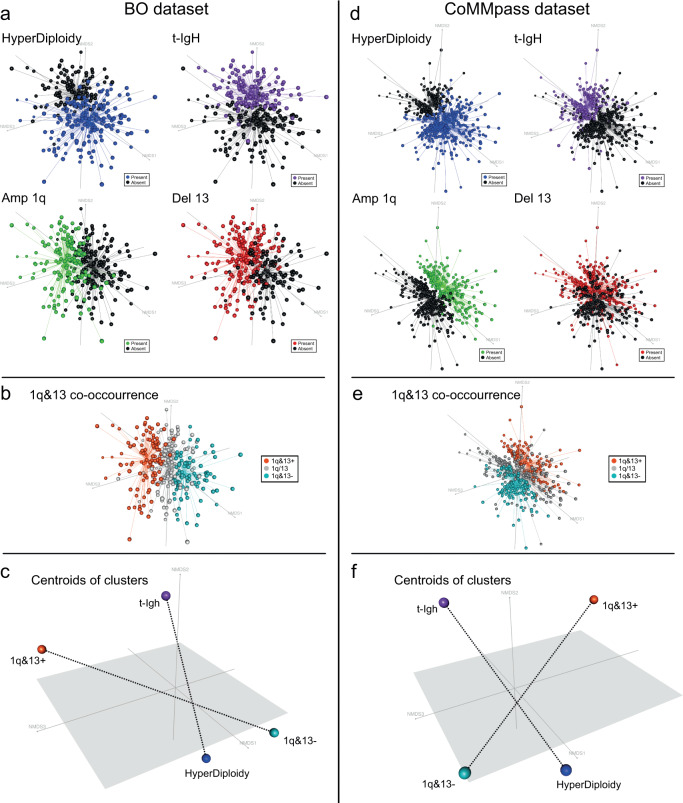
Fig. 3. Dimensionality reduction: tridimensional picture of the complex relationships observed between all MM genomic variants.
Each patient was represented by a dot, with cluster of dots —representing patients sharing similar genomic backgrounds—located accordingly in the dimensionality-reduced space. a, d Blue and violet clusters, representing patients carrying H and t-IgH, respectively, were located at the opposed extremities of the horizontal axis, whereas red and green clusters (representing patients carrying del13 and amp1q, respectively) tended to overlap and to locate along the vertical axis. b, e Orange, grey and teal clusters (representing 1q&13 + , 1q/13 and 1q&13- patients, respectively) identified three well-distinct clusters of patients located transversally with respect to those carrying HD and t-IgH. c, f The centroids of 1q&13 + , 1q&13-, HD and t-IgH clusters previously defined are represented, highlighting the transversal positioning of the 1q&13 axis with respect to the HD-IgH axis. Such axes are displayed by dashed lines that connect the centroids.

