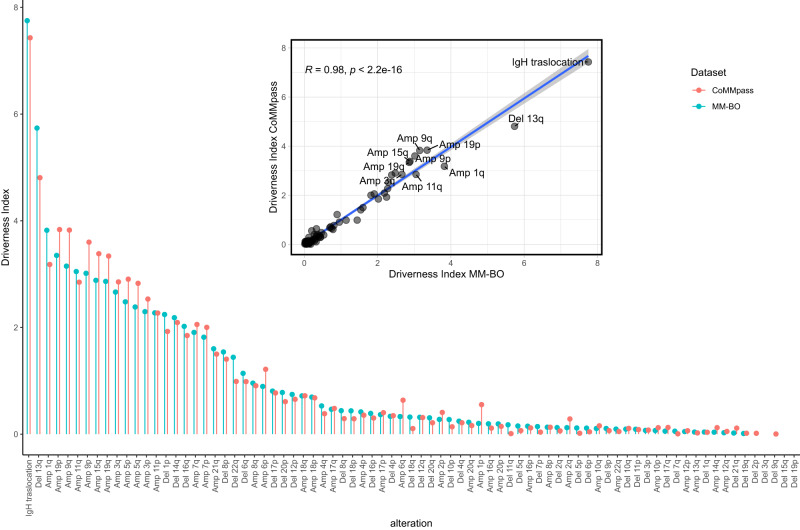
Fig. 4. Lollipop plot representing the Driverness Index (DI) score for each alteration, as evaluated both in the BO- (blue dots, n = 513 patients) and in the CoMMpass datasets (orange dots, n = 752 patients).
Alterations were sorted along the x axis accordingly to the BO-dataset’s DI. In the nested plot the CoMMpass DI scores are shown to be highly similar to BO DI scores (Spearman’s rho= 0.942, two-sided p = 8.73e–36), as illustrated by the closeness of the data points to the blue linear regression line. The 95% confidence interval error band of the linear regression line is represented by a shaded grey area around the line.

