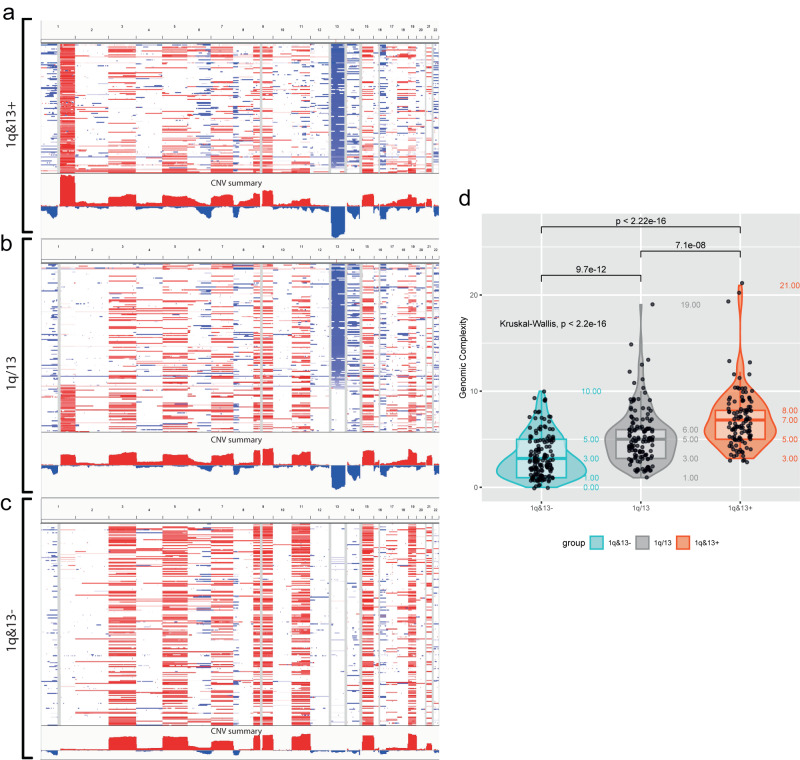
Fig. 5. Genomic context of patients stratified according to the “1q&13 classification”.
a–c Showed the CNAs profile of 1q&13 + , 1q/13 and 1q&13- patients, as obtained by IGV screenshots; CN gains and CN losses were highlighted in red and blue, respectively. d Box-Violin plot showing the statistically different genomic complexity distribution among the three subgroups of patients (Kruskal-Wallis test, p = 1.39e–19). Two-sided Mann–Whitney test was used to test subgroups pairwise differences. The box plot within each violin shows the median (central line), first quartile (bottom edge of the box), and third quartile (top edge of the box). The numbers within or near each plot indicate the minimum, first quartile, median, third quartile, and maximum number of chromosomal aberrations per subgroup. In this analysis, N = 512 independent patients were examined, each in a single independent experiment.

