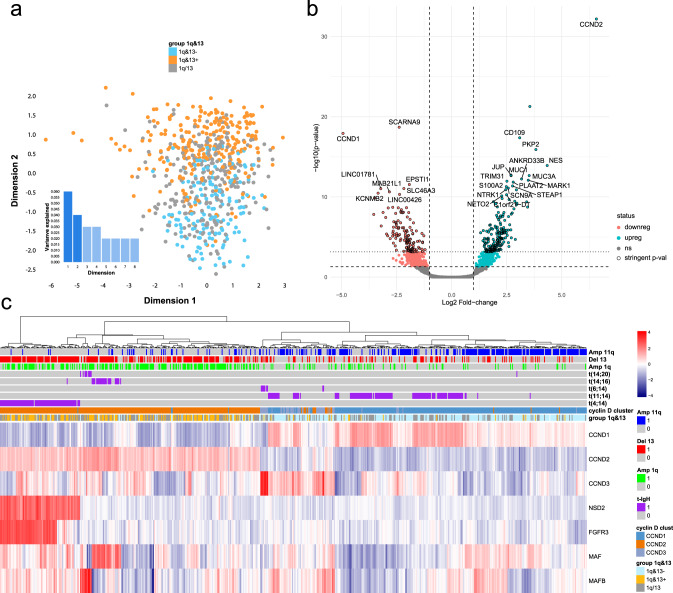
Fig. 6. Gene expression profile analysis (CoMMpass dataset).
RNA-seq, gene-based data, downloaded from CoMMpass IA14 were used to validate the biological significance of 1q&13 classification (n = 659 independent samples). a Raw transcriptome data dimensionality reduction analysis. Every dot represents a different sample: red= 1q&13 + , green=1q&13-, blue=1q/13; separate and opposite clusters were highlighted also at expression level. b Volcano plot of the 301 genes differentially expressed between 1q&13+ and 1q&13-. Stringent-significative and significative genes, as defined by Bayes-moderated t tests (“treat” and “eBayes” limma functions, respectively—additional details in “Methods”) are highlighted in cyan if upregulated and in pink if downregulated. The 301 stringent-significative genes are highlighted by a black stroke around the points. c Heatmap describing the unsupervised clustering of 7 genes representative of t-IgH expression profile. Columns represent patients. Colours are scaled row-wise according to the normalized expression values of genes. The 1q&13 classification is plotted over the heatmap (orange = 1q&13 + , blue= 1q&13-, green = 1q/13 + ).

