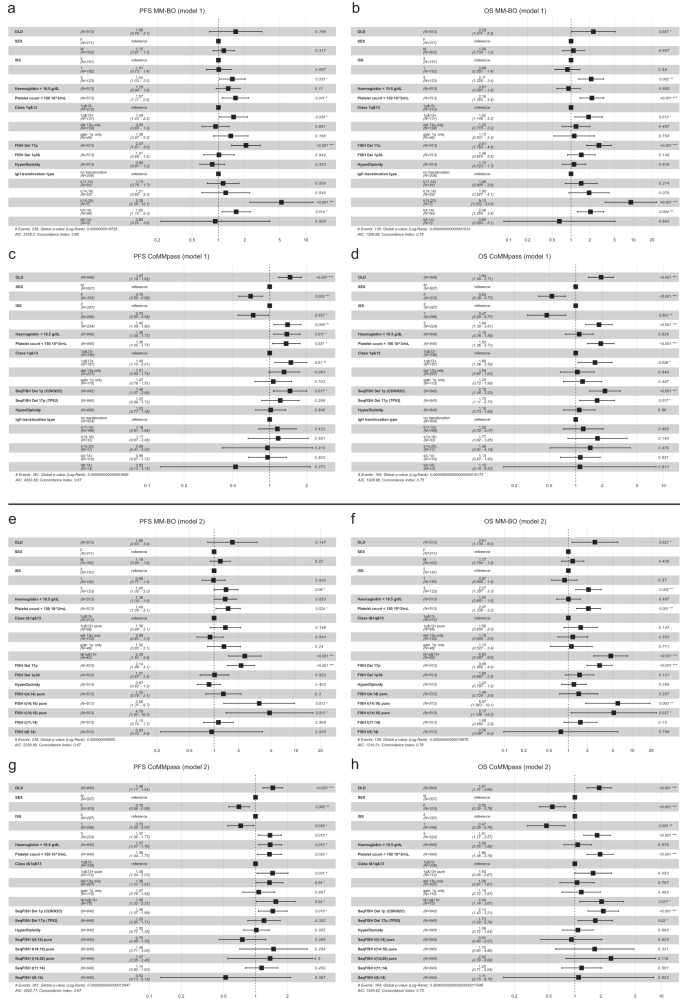
Fig. 8. Multivariate models for 1q&13 classification.
Forest plots of PFS and OS on Cox multivariate analyses: (a–d) model 1 (upper four panels) explored the risk of “1q&13” genomic configuration classes, (e–h) model 2 (lower four panels) explored the “t&1q&13” risk category classes. Analyses were performed both in the BO—and in the CoMMpass datasets. The squares along the centre line represent point estimates of the Hazard Ratios (HR) of variables included in the models, while horizontal lines extending from the squares represent 95% confidence intervals for each variable’s HR.

