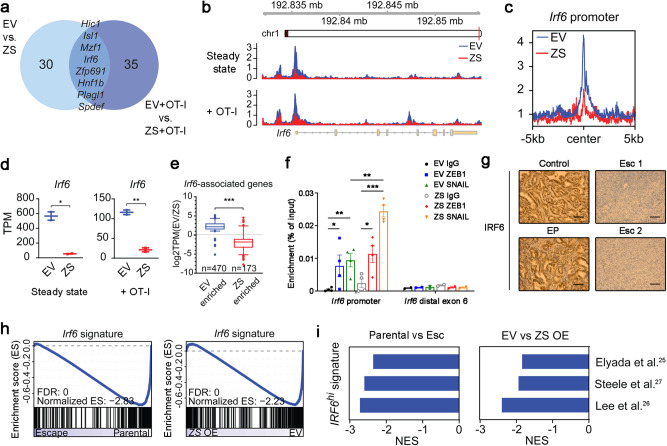
Fig. 4. Transcriptional and chromatin profiling identifies Irf6 as a potential regulator of acquired immunotherapy resistance.
a Venn diagram of HOMER de novo motifs identified in chromatin regions significantly enriched in EV vs. Zeb1/Snail OE (ZS) cell lines that have (right) or have not (left) been co-cultured with OT-1 cells (duplicates). Significantly enriched chromatin regions were defined as |log2fold change| > 1.4 and p value < 0.05 after DESeq2 analysis. b Genome browser track showing ATAC-seq reads along the Irf6 gene, comparing EV vs. Zeb1/Snail OE cell lines. c Aggregate plots comparing the average ATAC signal of EV (blue) and Zeb1/Snail OE (red) tumors around putative Irf6 promoter sequences. For details, see Methods. d Transcripts per million (TPMs) of Irf6 in EV vs. Zeb1/Snail OE tumors that have (right) or have not (left) been co-cultured with OT-1 cells (duplicates). e Boxplots (log2fold) showing the expression of Irf6-associated genes with differentially open chromatin in parental EV (left, n = 470 genes) vs. Zeb1/Snail OE (right, n = 173 genes) tumors. Centre and whiskers represent means and 2.5-97.5 percentiles. f ChIP with control IgG or antibodies to ZEB1 and SNAIL in DNA from 4662 parental EV and Zeb1/Snail OE (ZS) tumor cells, followed by qPCR quantification in enriched DNA using primers for Irf6 putative promoter and distal exon 6 regions. Data represent two independent experiments. g Representative IHC images of IRF6 in the original primary tumor tissues from control, EP, and Esc tumor-bearing mice. Scale bars, 250 µm. h GSEA plots of an Irf6-dependent gene signature (derived by comparing Irf6-expressing tumors to controls; provided in Supplementary Data 2) in parental vs. Esc (left) (triplicates) and parental EV vs. Zeb1/Snail OE (right) (duplicates) tumors. i GSEA of gene signatures derived from human PDAC cells that highly express IRF6 in parental vs. Esc (left) and EV vs Zeb1/Snail OE tumors (right). Negative normalized enrichment scores (NES) demonstrate enrichment in parental and EV tumors compared to Esc and Zeb1/Snail OE tumors, respectively. Data are presented as mean ± SEM unless otherwise indicated. *P < 0.05, **P < 0.01, ***P < 0.0001 by Student’s t test (d, e) and one-way ANOVA (f). Source data and exact P value are provided as a Source Data file.

