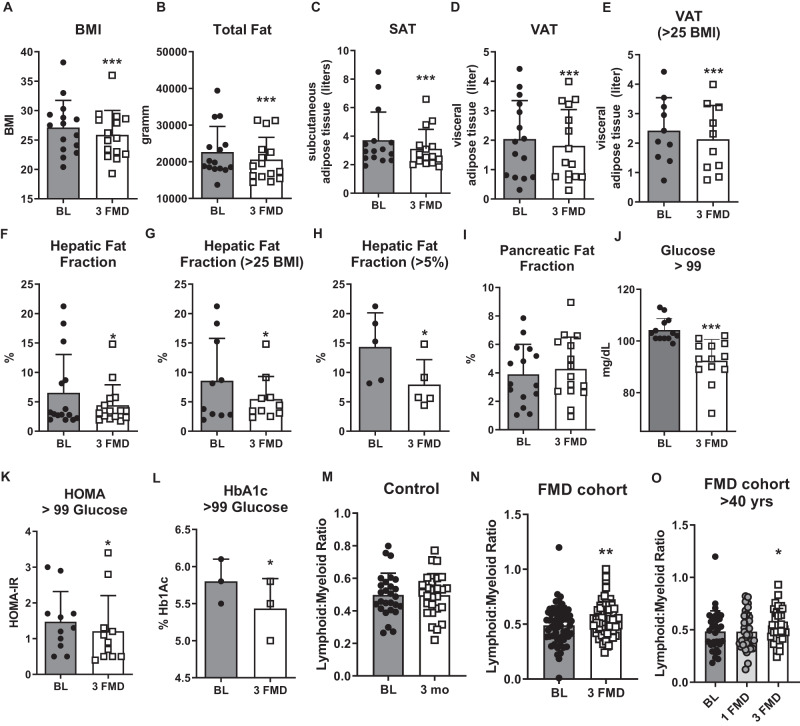
Fig. 2. Fasting-mimicking decreases the hepatic fat fraction and diabetes risk markers, and increases the lymphoid to myeloid ratio.
A Body mass index BMI; N = 15 biologically independent samples. p = 0.0002; Baseline (BL)= gray bar, 3 fasting-mimicking diet (FMD) cycles= white bar. B Total fat in grams; N = 15 biologically independent samples measured by DEXA. p = 0.0021. C Subcutaneous adipose tissue (SAT) in liters; N = 15 biologically independent samples. p = 0.0084. D Visceral adipose tissue (VAT) in liters; N = 15 biologically independent samples. p = 0.0017. E Visceral adipose tissue (VAT) in liters for study participants affected by overweight and obesity; N = 10. p = 0.0030. F Hepatic fat fraction (HFF) in percent for all study participants (N = 15, p = 0.0495) and G HFF in study participants affected by overweight and obesity (N = 10, p = 0.0465) and (H) for study participants with fatty liver described as >5% HFF (N = 5, p = 0.0197). I Pancreatic fat fraction (PFF) for N = 15 study participants. p = 0.2778. J Serum glucose in pre-diabetic study participants at baseline and after 3 FMD cycles; N = 13. p = < 0.0001. K Homeostatic model assessment to measure insulin resistance (HOMA-IR) in pre-diabetic study participants; N = 11. p = 0.0455. L Hemoglobin A1c (HbA1c) levels in pre-diabetic study participants; N = 3. p = 0.0315. M The lymphoid to myeloid ratio in study participants that maintained a normal diet; N = 27. p = 0.9723 Baseline (BL)= gray bar, 3 month follow-up (3mo)= white bar. N Following 3 monthly cycles of a fasting-mimicking diet, the lymphoid to myeloid ratio was increased for all participants that completed the trial; N = 61. p = 0.0049. O The lymphoid to myeloid ratio at baseline for study participants older than 40 years at baseline (BL > 40; N = 34; dark gray bar), after completion of the 1st FMD cycle (p = 0.9585; 1FMD light gray bar) and 3–5 days of resuming normal food intake after the 3rd FMD cycle (p = 0.0356, 3 FMD white bar). Mean ± SD. Paired two-tailed t-test. *p < 0.05, **p < 0.01, ***p < 0.001. C–I measured by MRI. Source data are provided as a Source Data file.

